Fabric Data Days starts November 4th!
Advance your Data & AI career with 50 days of live learning, dataviz contests, hands-on challenges, study groups & certifications and more!
Get registered- Power BI forums
- Get Help with Power BI
- Desktop
- Service
- Report Server
- Power Query
- Mobile Apps
- Developer
- DAX Commands and Tips
- Custom Visuals Development Discussion
- Health and Life Sciences
- Power BI Spanish forums
- Translated Spanish Desktop
- Training and Consulting
- Instructor Led Training
- Dashboard in a Day for Women, by Women
- Galleries
- Data Stories Gallery
- Themes Gallery
- Contests Gallery
- Quick Measures Gallery
- Visual Calculations Gallery
- Notebook Gallery
- Translytical Task Flow Gallery
- TMDL Gallery
- R Script Showcase
- Webinars and Video Gallery
- Ideas
- Custom Visuals Ideas (read-only)
- Issues
- Issues
- Events
- Upcoming Events
Get Fabric Certified for FREE during Fabric Data Days. Don't miss your chance! Learn more
- Power BI forums
- Forums
- Get Help with Power BI
- Desktop
- Replicate chart in Excel in Power BI
- Subscribe to RSS Feed
- Mark Topic as New
- Mark Topic as Read
- Float this Topic for Current User
- Bookmark
- Subscribe
- Printer Friendly Page
- Mark as New
- Bookmark
- Subscribe
- Mute
- Subscribe to RSS Feed
- Permalink
- Report Inappropriate Content
Replicate chart in Excel in Power BI
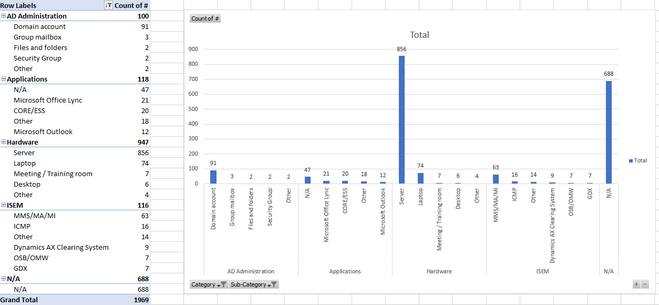
In Excel I can create a chart that looks like this, it shows me the top 5 Categories along with the top 5 sub categories for each category. Note how the category labels appears underneath as a kind of parent header rather than on every sub category label
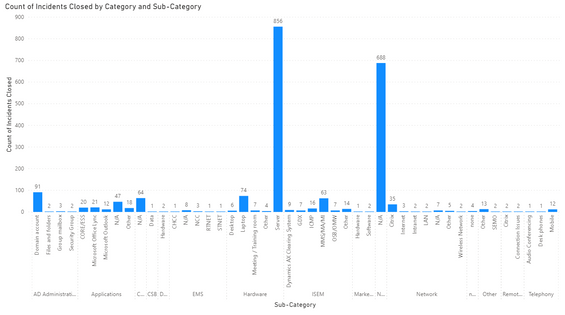
However when I try to make this in Power BI the ranking seems all over the place. If I have just Category in the axis than the rank I've setup displays the top Five just fine, likewise for Sub-category. But when I have both Category and Sub-Category it goes all wonky. Additionally rather than show a header label for Category it adds the Category label to every Sub-Category label making it far messier.
I've seen BI charts using dates display it similar to how Excel does above so I assume such a thing is possible.
The Ranks I'm using are just
- Mark as New
- Bookmark
- Subscribe
- Mute
- Subscribe to RSS Feed
- Permalink
- Report Inappropriate Content
It is supposed to work like this:
https://community.powerbi.com/t5/Desktop/X-Axis-Label-Hierarchy/m-p/841928#M404293
I posted this as an issue.
Follow on LinkedIn
@ me in replies or I'll lose your thread!!!
Instead of a Kudo, please vote for this idea
Become an expert!: Enterprise DNA
External Tools: MSHGQM
YouTube Channel!: Microsoft Hates Greg
Latest book!: DAX For Humans
DAX is easy, CALCULATE makes DAX hard...
- Mark as New
- Bookmark
- Subscribe
- Mute
- Subscribe to RSS Feed
- Permalink
- Report Inappropriate Content
Indeed I've tried that and it didn't work. If its not broken then perhaps its something to do with my fields as like the example you provided its dates, I've not seen it work with text based fields before, though I would think it used the same logic.
I even tried creating a heiarchy using the two fields but it didn't seem to have any affect on how they displayed.
- Mark as New
- Bookmark
- Subscribe
- Mute
- Subscribe to RSS Feed
- Permalink
- Report Inappropriate Content
Okay I've managed to fix the labels. If I place Category and Sub-Category into a heirarchy and then turn Concatenate off it fixed the labels however the Rank's still appear to not be working as intended.
I need top 5 cateogries and top 5 sub categories of each of the top 5 categories as shown in the Excel image in the main post. Current rank measures are written above for refernece, presumably they need some modifying.
- Mark as New
- Bookmark
- Subscribe
- Mute
- Subscribe to RSS Feed
- Permalink
- Report Inappropriate Content
I would say to turn off "concatenate labels" in X axis but that appears to have zero effect, I wonder if it is broken?
Follow on LinkedIn
@ me in replies or I'll lose your thread!!!
Instead of a Kudo, please vote for this idea
Become an expert!: Enterprise DNA
External Tools: MSHGQM
YouTube Channel!: Microsoft Hates Greg
Latest book!: DAX For Humans
DAX is easy, CALCULATE makes DAX hard...
Helpful resources

Fabric Data Days
Advance your Data & AI career with 50 days of live learning, contests, hands-on challenges, study groups & certifications and more!

Power BI Monthly Update - October 2025
Check out the October 2025 Power BI update to learn about new features.


