Fabric Data Days starts November 4th!
Advance your Data & AI career with 50 days of live learning, dataviz contests, hands-on challenges, study groups & certifications and more!
Get registered- Power BI forums
- Get Help with Power BI
- Desktop
- Service
- Report Server
- Power Query
- Mobile Apps
- Developer
- DAX Commands and Tips
- Custom Visuals Development Discussion
- Health and Life Sciences
- Power BI Spanish forums
- Translated Spanish Desktop
- Training and Consulting
- Instructor Led Training
- Dashboard in a Day for Women, by Women
- Galleries
- Data Stories Gallery
- Themes Gallery
- Contests Gallery
- Quick Measures Gallery
- Visual Calculations Gallery
- Notebook Gallery
- Translytical Task Flow Gallery
- TMDL Gallery
- R Script Showcase
- Webinars and Video Gallery
- Ideas
- Custom Visuals Ideas (read-only)
- Issues
- Issues
- Events
- Upcoming Events
Get Fabric Certified for FREE during Fabric Data Days. Don't miss your chance! Learn more
- Power BI forums
- Forums
- Get Help with Power BI
- Desktop
- Rename Axis from Auto Label
- Subscribe to RSS Feed
- Mark Topic as New
- Mark Topic as Read
- Float this Topic for Current User
- Bookmark
- Subscribe
- Printer Friendly Page
- Mark as New
- Bookmark
- Subscribe
- Mute
- Subscribe to RSS Feed
- Permalink
- Report Inappropriate Content
Rename Axis from Auto Label
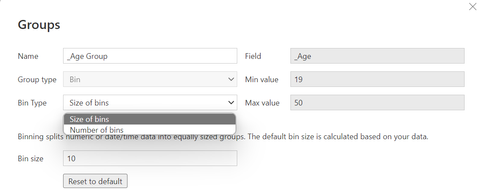
I am grouping the age using Data Groups function in Power BI. In its setting, I have selected Size of bins and Power BI auto detected the minimum and maximum values of the age column are 19 and 50 respectively. So, it will decide the number of group.
I have the output in the bar chart below. My question is how can I rename the X-axis. For example the first bar is name as 1-19, second bar is 20-29, and etc.
Solved! Go to Solution.
- Mark as New
- Bookmark
- Subscribe
- Mute
- Subscribe to RSS Feed
- Permalink
- Report Inappropriate Content
Something like this as a new column...
Age Range =
    SWITCH(
        TRUE(),
        'Table'[Age] < 19, "0 - 19",
        'Table'[Age] < 39, "20 - 39",
        'Table'[Age] < 59, "40 - 59",
        "60+"
        )
Substitute your table name and column name.
| Have I solved your problem? Please click Accept as Solution so I don't keep coming back to this post, oh yeah, others may find it useful also ;). |
- Mark as New
- Bookmark
- Subscribe
- Mute
- Subscribe to RSS Feed
- Permalink
- Report Inappropriate Content
It might be possible to create a custom label for the axis as a new column based on the bin values, but, to be honest, it is probably easier to just control the grouping yourself. This could be done in Power Query or DAX depending on your preference.
This is a good article to explain one way to approach it...
https://radacad.com/create-customized-age-bins-or-groups-in-power-bi
There are a number of links in there showing how to make it controllable with measures also.
| Have I solved your problem? Please click Accept as Solution so I don't keep coming back to this post, oh yeah, others may find it useful also ;). |
- Mark as New
- Bookmark
- Subscribe
- Mute
- Subscribe to RSS Feed
- Permalink
- Report Inappropriate Content
Something like this as a new column...
Age Range =
    SWITCH(
        TRUE(),
        'Table'[Age] < 19, "0 - 19",
        'Table'[Age] < 39, "20 - 39",
        'Table'[Age] < 59, "40 - 59",
        "60+"
        )
Substitute your table name and column name.
| Have I solved your problem? Please click Accept as Solution so I don't keep coming back to this post, oh yeah, others may find it useful also ;). |
Helpful resources

Fabric Data Days
Advance your Data & AI career with 50 days of live learning, contests, hands-on challenges, study groups & certifications and more!

Power BI Monthly Update - October 2025
Check out the October 2025 Power BI update to learn about new features.


