Fabric Data Days starts November 4th!
Advance your Data & AI career with 50 days of live learning, dataviz contests, hands-on challenges, study groups & certifications and more!
Get registered- Power BI forums
- Get Help with Power BI
- Desktop
- Service
- Report Server
- Power Query
- Mobile Apps
- Developer
- DAX Commands and Tips
- Custom Visuals Development Discussion
- Health and Life Sciences
- Power BI Spanish forums
- Translated Spanish Desktop
- Training and Consulting
- Instructor Led Training
- Dashboard in a Day for Women, by Women
- Galleries
- Data Stories Gallery
- Themes Gallery
- Contests Gallery
- Quick Measures Gallery
- Visual Calculations Gallery
- Notebook Gallery
- Translytical Task Flow Gallery
- TMDL Gallery
- R Script Showcase
- Webinars and Video Gallery
- Ideas
- Custom Visuals Ideas (read-only)
- Issues
- Issues
- Events
- Upcoming Events
Join us at FabCon Atlanta from March 16 - 20, 2026, for the ultimate Fabric, Power BI, AI and SQL community-led event. Save $200 with code FABCOMM. Register now.
- Power BI forums
- Forums
- Get Help with Power BI
- Desktop
- Reference data in charts in text box
- Subscribe to RSS Feed
- Mark Topic as New
- Mark Topic as Read
- Float this Topic for Current User
- Bookmark
- Subscribe
- Printer Friendly Page
- Mark as New
- Bookmark
- Subscribe
- Mute
- Subscribe to RSS Feed
- Permalink
- Report Inappropriate Content
Reference data in charts in text box
I need to generate sentences referencing data in graphs, e.g. the 32% and 30% in the chart as shown below:
to come out with sentences like "the highest X is [value] at [percent]".
Currently I'm using the Smart Narrative function to add these to text boxes as values:
(the real fields have been replaced with xxxx)
However, I'm having difficulties getting the AI to generate values as percentage of grand total, as well as perform arithmetic operations. Is there a way to generate these numbers as text easily, without the need to rewrite every graph's data and filter contexts as a DAX measure?
Solved! Go to Solution.
- Mark as New
- Bookmark
- Subscribe
- Mute
- Subscribe to RSS Feed
- Permalink
- Report Inappropriate Content
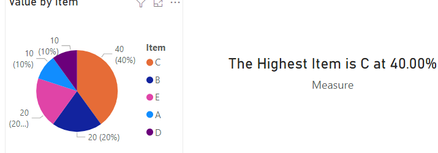
You can create a measure using a card visual. Please check my example below:
Paul Zheng _ Community Support Team
If this post helps, please Accept it as the solution to help the other members find it more quickly.
- Mark as New
- Bookmark
- Subscribe
- Mute
- Subscribe to RSS Feed
- Permalink
- Report Inappropriate Content
@bleow , Try a measure like
divide(CALCULATE([Measure],TOPN(1,allselected('Table'[category]),[Measure],DESC),VALUES('Table'[category])), [Measure])
or
divide(CALCULATE([Measure],TOPN(1,allselected('Table'[category]),[Measure],DESC),VALUES('Table'[category])), calculate([Measure],all(Table)))


