FabCon is coming to Atlanta
Join us at FabCon Atlanta from March 16 - 20, 2026, for the ultimate Fabric, Power BI, AI and SQL community-led event. Save $200 with code FABCOMM.
Register now!- Power BI forums
- Get Help with Power BI
- Desktop
- Service
- Report Server
- Power Query
- Mobile Apps
- Developer
- DAX Commands and Tips
- Custom Visuals Development Discussion
- Health and Life Sciences
- Power BI Spanish forums
- Translated Spanish Desktop
- Training and Consulting
- Instructor Led Training
- Dashboard in a Day for Women, by Women
- Galleries
- Data Stories Gallery
- Themes Gallery
- Contests Gallery
- QuickViz Gallery
- Quick Measures Gallery
- Visual Calculations Gallery
- Notebook Gallery
- Translytical Task Flow Gallery
- TMDL Gallery
- R Script Showcase
- Webinars and Video Gallery
- Ideas
- Custom Visuals Ideas (read-only)
- Issues
- Issues
- Events
- Upcoming Events
The Power BI Data Visualization World Championships is back! Get ahead of the game and start preparing now! Learn more
- Power BI forums
- Forums
- Get Help with Power BI
- Desktop
- Re: Ragged hierarchy Visualization
- Subscribe to RSS Feed
- Mark Topic as New
- Mark Topic as Read
- Float this Topic for Current User
- Bookmark
- Subscribe
- Printer Friendly Page
- Mark as New
- Bookmark
- Subscribe
- Mute
- Subscribe to RSS Feed
- Permalink
- Report Inappropriate Content
Ragged hierarchy Visualization
We have a ragged hierarchy in our organization structure. Where some departmensts of the organizations go down to 4 levels, some go down till 8. We are trying to create a Power BI report where different stats get filtered based on the level of department selected. The only visuals I could find are the hierarchy slicer custom visual and the Matrix Preview visual. However, as the number of levels differ in data, the visuals have a lot of blank space. Example data and visuals are
Is there a way to visualize the data in a better way in Power BI?
- Mark as New
- Bookmark
- Subscribe
- Mute
- Subscribe to RSS Feed
- Permalink
- Report Inappropriate Content
Please consider voting to my idea to add this option to the Matrix visual:
- Mark as New
- Bookmark
- Subscribe
- Mute
- Subscribe to RSS Feed
- Permalink
- Report Inappropriate Content
Any news on this issue ?
Still not able to hide blank members in matrix visual
- Mark as New
- Bookmark
- Subscribe
- Mute
- Subscribe to RSS Feed
- Permalink
- Report Inappropriate Content
Now we can hide the blank values in Hierarchy slicer by turning off the Empty Leaves selection option.
- Mark as New
- Bookmark
- Subscribe
- Mute
- Subscribe to RSS Feed
- Permalink
- Report Inappropriate Content
Was this option removed at somepoint? I am on the Feb 2022 client and do not see Empty leaves under the selection options on my Hierarchy Slicer.
- Mark as New
- Bookmark
- Subscribe
- Mute
- Subscribe to RSS Feed
- Permalink
- Report Inappropriate Content
Here is the solution!
Hi all,
I was having the same problem and I could not find anything on the web that truely solved this issue, so I developed my own modeling that would address this problem of "blanck"s appearing in visualization from ragged hierarchies.
Here is my solution:
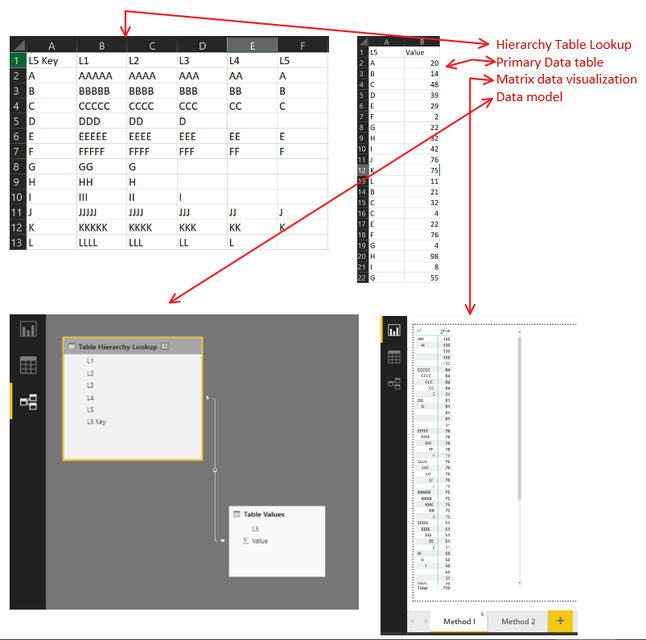
On a high level, the solution calls for your hierarchy data table to be segmented into separate data tables to then be interconnected with a 'many to one' relationship. These hierarchy lookup tables then will be connected to your primary data table.
Take the following two examples I created to validate this method
Solution 1 (does not work):
1. Create a Hierarchy table that you will use as a lookup for your primary data. the format of this table is shown below.
a. Create a primary key column that refers to your last level
b. Create several columns that describe your hierarchy i.e. L1, L2, L3, ect.
c. Do not repeat members or level blanks before the end of your hierarchy
2. Create a many to one relationship between your hierarchy lookup table and our primary table.
3. Run a matrix visualization b dragging the values column from your primary data table into the values field and drag all your levels (L1, L2, L2 ect.) into the row section of the visualization.
You will notice the "blank" values problem persists. To resolve this, try solution 2 shown in the next set of pictures
l
Solution 2:
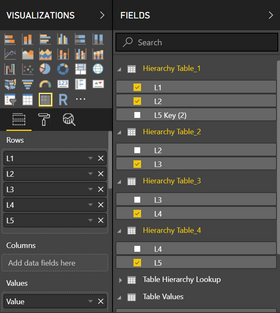
1. Segment the larger hierarchy data lookup table into 4 separate data tables. Follow the picture examples below for exact designing
a. As you move from one hierarchy table to the next, generate new levels and tables and eliminate those observations in subsequent tables once the final levels of that observation has been reached. Please see picture below for further detail.
2. Link your tables together following the specific relationship cardinality as shown below
3. Run a matrix visualization by dragging the values column from your primary data table into the values field and drag your different levels (L1, L2, L3 ect.) from each new hierarchy data tables into the row section of the visualization.
Following these steps will resolve the blank values you see when displaying hierarchical data that is builded off of ragged hierarchies.
visualization input order:
I hope this helps you and anyone struggling with this issue.
Best,
Eric
- Mark as New
- Bookmark
- Subscribe
- Mute
- Subscribe to RSS Feed
- Permalink
- Report Inappropriate Content
Hi Eric,
In your example there is only one child beneath each level. If a level has multiple children the relationship becomes many-to-many and this solution does not seem to work - am I missing something?
- Mark as New
- Bookmark
- Subscribe
- Mute
- Subscribe to RSS Feed
- Permalink
- Report Inappropriate Content
Hi @kevinascott ,
Since proposing this solution, Power BI has released tools to manage regged hierarchies better.
I would recommend looking into the expand/collapse formatting option for your matrix viz. You can find this option in the format section by searching '+' in the search bar.
There is also an option to hide blank rows.
I hope this helps.
Best,
Eric
- Mark as New
- Bookmark
- Subscribe
- Mute
- Subscribe to RSS Feed
- Permalink
- Report Inappropriate Content
Hi @DataExplorer,
Ragged Hierarchy is currently not supported in Power BI Desktop, there is no option to hide blank values in visuals when child Hierarchy has no data in your table. You can vote up this existing idea: https://ideas.powerbi.com/forums/265200-power-bi-ideas/suggestions/14511612-ragged-or-parent-child-h... .
In addition, for hierarchy slicer custom visual, the feature that hide blanks is in development and the feature will be released in the next version(0.8.x), for more details, please review this blog: https://azurebi.jppp.org/2016/04/02/changelog-hierarchy-slicer/.
Thanks,
Lydia Zhang
- Mark as New
- Bookmark
- Subscribe
- Mute
- Subscribe to RSS Feed
- Permalink
- Report Inappropriate Content
Hi Lydia
Has there been any progress or workarounds with ragged hierarchy visualisation? I have a blank value in a parent child relationship like the graph below. My data hierarchy goes 9 levels down and if I remove the child blank using the visual level filter it begins to exclude data on the prior levels.
The hierarchy custom slicer allows me to remove blanks in the slicer itself but they still remain in the graph as below.
Thank you.
- Mark as New
- Bookmark
- Subscribe
- Mute
- Subscribe to RSS Feed
- Permalink
- Report Inappropriate Content
Thanks @Anonymous!
- Mark as New
- Bookmark
- Subscribe
- Mute
- Subscribe to RSS Feed
- Permalink
- Report Inappropriate Content
This looks like a bug in both the Matrix Preview and Hierarchy Slicer. The original, non-preview, Matrix visual does not display the "empty" tiers.
- Mark as New
- Bookmark
- Subscribe
- Mute
- Subscribe to RSS Feed
- Permalink
- Report Inappropriate Content
Please try Inforiver (https://inforiver.com/) in AppSource Visual as it handles ragged hierarchies inside matrix visuals automatically as well as treat blanks and nulls as well in display properties
Helpful resources

Power BI Dataviz World Championships
The Power BI Data Visualization World Championships is back! Get ahead of the game and start preparing now!

| User | Count |
|---|---|
| 37 | |
| 37 | |
| 33 | |
| 32 | |
| 29 |
| User | Count |
|---|---|
| 130 | |
| 88 | |
| 82 | |
| 68 | |
| 64 |


