
cancel
Showing results for 
Search instead for 
Did you mean: 

July 7 - July 17 | Round 2 of the Power BI Dataviz World Championships. Don't miss your chance! Learn more

Reply
TCavins
Helper V
Helper V

RANKX Help

I have a table with the following columns.


Person

Site

Manager

IncidentID


I want my visualization to be:

Person, Site, Manager, DISTINCTCOUNT(IncidentID), Rank(1 - whatever, based on the distinct count in the table).


Rough data I'd like displayed in the table:

Bob, Site A, Manager 1, 50, 1

Steve, Site C, Mgr 2, 49, 2

Bob, Site A, Manager 2, 47, 3


Everything I try for RANKX shows 1 for the rank. I've tried Measures and Calculated Column. Any help?

5 REPLIES 5
amitchandak
Super User
Super User

rank as new column = rank(all(table),table[IncidentID])


For Rank Refer these links
https://radacad.com/how-to-use-rankx-in-dax-part-2-of-3-calculated-measures
https://radacad.com/how-to-use-rankx-in-dax-part-1-of-3-calculated-columns
https://radacad.com/how-to-use-rankx-in-dax-part-3-of-3-the-finale


Appreciate your Kudos. In case, this is the solution you are looking for, mark it as the Solution.
In case it does not help, please provide additional information and mark me with @

Thanks. My Recent Blogs -Decoding Direct Query - Time Intelligence, Winner Coloring on MAP, HR Analytics, Power BI Working with Non-Standard TimeAnd Comparing Data Across Date Ranges
Connect on Linkedin

Share with Power BI Enthusiasts: Full Power BI Video (20 Hours) YouTube
Microsoft Fabric Series 60+ Videos YouTube
Microsoft Fabric Hindi End to End YouTube

That did not work. I'm trying the following Measure but it only works if Manager is not in the visualization.


Measure = IF(ISINSCOPE(MyTable[Manager]),RANKX(ALLSELECTED(MyTable),CALCULATE(DISTINCTCOUNT(MyTable[INCIDENTID])),,DESC,DENSE),RANKX(ALLSELECTED(MyTable[Person]),CALCULATE(DISTINCTCOUNT(MyTable[INCIDENTID])),,DESC,DENSE))

Found another solution that is close but the rank numbers are off, especially if Manager is empty:


Measure 3 =
Var summry = SUMMARIZE(ALLSELECTED(MyTable),[Person],"DistCount",DISTINCTCOUNT(MyTable[INCIDENTID]))
var tmp = ADDCOLUMNS(summry,"RNK", RANKX(summry,[DistCount],,DESC,DENSE))
return
MAXX(FILTER(tmp,[Person]=SELECTEDVALUE(MyTable[Person])),[RNK])


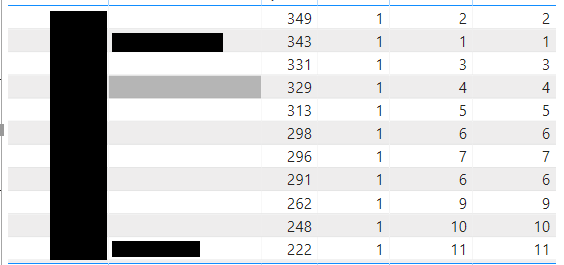
Gives the following output. The second row should be rank 2 and the first row should be rank 1. I've blocked out any preson information. Columns are Person, manager, distinct count of IDs then 3 measure I'm trying for rank. Last column is the measure above.


tempsnip.png

Hi @TCavins ,


Try  to create a calculated column as below:


Column =
VAR summry =
    SUMMARIZE (
        ALLSELECTED ( MyTable ),
        [Person],
        "DistCount", DISTINCTCOUNT ( MyTable[INCIDENTID] )
    )
RETURN
    RANKX ( summry, [DistCount],, DESC, DENSE )


Best Regards,
Kelly

This isn't working for me.


DistCount.JPG

Helpful resources

Announcements
FabCon and SQLCon Barcelona 2026

FabCon & SQLCon – Barcelona 2026

Join us in Barcelona for FabCon and SQLCon, the Fabric, Power BI, SQL, and AI community event. Save €200 with code FABCMTY200.

60 days of Data Days Carousel

Data Days 2026

Join Data Days 2026: 60 days of free live/on-demand sessions, challenges, study groups, and certification opportunities.

Power BI DataViz World Championships carousel

Power BI DataViz World Championships - June 2026

A new Power BI DataViz World Championship is coming this June! Don't miss out on submitting your entry.

Top Solution Authors