cancel
Showing results for 
Search instead for 
Did you mean: 

July 7 - July 17 | Round 2 of the Power BI Dataviz World Championships. Don't miss your chance! Learn more

Reply
mischelin11
Advocate I
Advocate I

R function set.seed() does not work in Power BI R script visual

 
Hi
 

I need to compute and visualize cluster analysis from R in Power BI desktop. I use set.seed()function to prevent clusters from changing over time. I run this code first in Power BI Desktop and next time i publish it and run it in Power BI services. And here is the problem, because in Power BI desktop it make different (different order) clusters then in Power BI services. Is it possible that the problem is in the set.seed function?

A part of R code is:

set.seed(123)
km.res <- kmeans(scale(costs_noout_of), 4, nstart = 25)
dd <- cbind(costs_noout_all , cluster = km.res$cluster)
grid.table(ddply(dd, .(cluster), nrow))

And result is a table where is only numbers of clusters and counts of observations in that clusters, which i need in the following calculations.

Can anyone helps me?

3 REPLIES 3
v-chuncz-msft
Community Support
Community Support

@mischelin11,


If convenient, please elaborate and share a more complete example for a quick test.

Community Support Team _ Sam Zha
If this post helps, then please consider Accept it as the solution to help the other members find it more quickly.


 Hi @v-chuncz-msft,


I dont know, how to add more complete example for this issue.

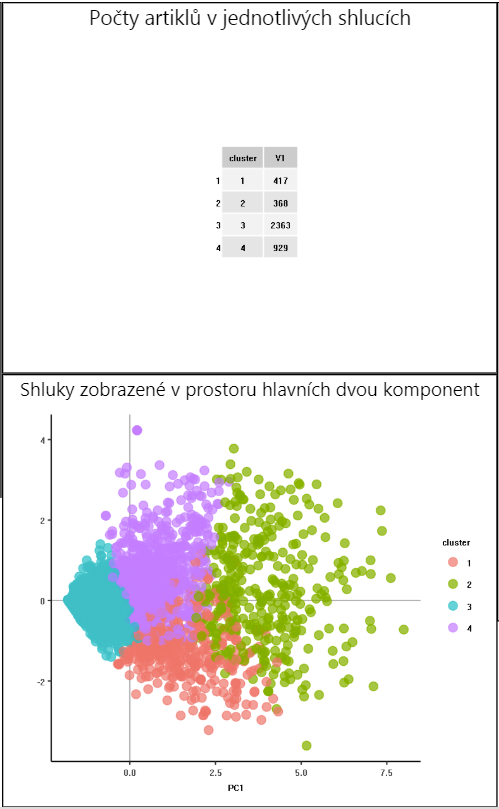
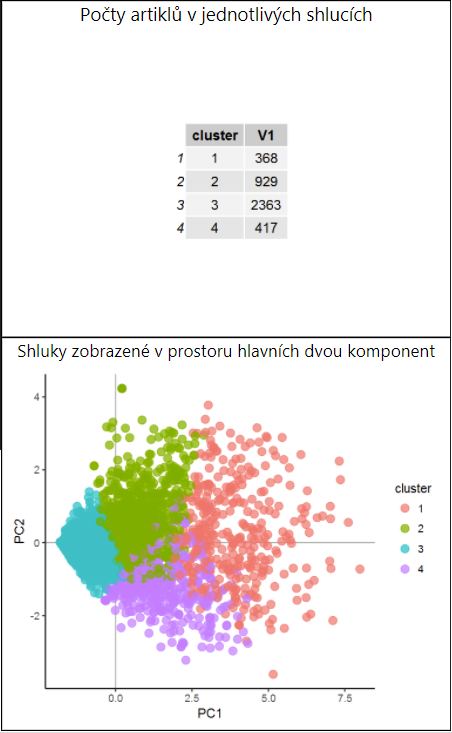
I can only add two graphical results, first is from Power BI services and second is from Power BI Desktop. As you can see, these results are a little different.


Result from Power BI services:

Capture.PNG


Result from Power BI Desktop:

Capture2.PNG


@mischelin11,


This seems to be caused by sorting. Check if you could specify the sort order in R.

Community Support Team _ Sam Zha
If this post helps, then please consider Accept it as the solution to help the other members find it more quickly.

Helpful resources

Announcements
FabCon and SQLCon Barcelona 2026

FabCon & SQLCon – Barcelona 2026

Join us in Barcelona for FabCon and SQLCon, the Fabric, Power BI, SQL, and AI community event. Save €200 with code FABCMTY200.

60 days of Data Days Carousel

Data Days 2026

Join Fabric Data Days 2026: 60 days of free live/on-demand sessions, challenges, study groups, and certification opportunities.

Power BI DataViz World Championships carousel

Power BI DataViz World Championships - June 2026

A new Power BI DataViz World Championship is coming this June! Don't miss out on submitting your entry.