FabCon is coming to Atlanta
Join us at FabCon Atlanta from March 16 - 20, 2026, for the ultimate Fabric, Power BI, AI and SQL community-led event. Save $200 with code FABCOMM.
Register now!- Power BI forums
- Get Help with Power BI
- Desktop
- Service
- Report Server
- Power Query
- Mobile Apps
- Developer
- DAX Commands and Tips
- Custom Visuals Development Discussion
- Health and Life Sciences
- Power BI Spanish forums
- Translated Spanish Desktop
- Training and Consulting
- Instructor Led Training
- Dashboard in a Day for Women, by Women
- Galleries
- Data Stories Gallery
- Themes Gallery
- Contests Gallery
- QuickViz Gallery
- Quick Measures Gallery
- Visual Calculations Gallery
- Notebook Gallery
- Translytical Task Flow Gallery
- TMDL Gallery
- R Script Showcase
- Webinars and Video Gallery
- Ideas
- Custom Visuals Ideas (read-only)
- Issues
- Issues
- Events
- Upcoming Events
The Power BI Data Visualization World Championships is back! Get ahead of the game and start preparing now! Learn more
- Power BI forums
- Forums
- Get Help with Power BI
- Desktop
- Problem with conditional formatting on specific mo...
- Subscribe to RSS Feed
- Mark Topic as New
- Mark Topic as Read
- Float this Topic for Current User
- Bookmark
- Subscribe
- Printer Friendly Page
- Mark as New
- Bookmark
- Subscribe
- Mute
- Subscribe to RSS Feed
- Permalink
- Report Inappropriate Content
Problem with conditional formatting on specific month
I am new to Power BI and now stuck in writing a measure to do conditional formatting.
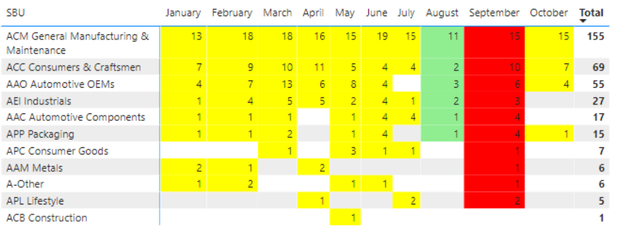
I want to show if the number of complaints in different business units increase from last month to current month.
As it's still October now, conditional formatting should show the difference between August and September. Red refers to number increase, Green decrease, and yello when number is unchanged. This is how it should look like (I did it in Excel):
I tried to write a measure as below but it ends up applying to the entire visual and those that are empty are not calculated.

I have two questions here:
1. Can I only apply conditional formatting (background color) to October?
2. For those that are blank, how can I make it become 0 so that the measure can work for the conditional formatting?
Thanks for helping!
- Mark as New
- Bookmark
- Subscribe
- Mute
- Subscribe to RSS Feed
- Permalink
- Report Inappropriate Content
@Anonymous , Add +0 to the measure so that will show 0 in place of blank
+0 can force left join, so I usuallt prefer.
0 between range
Measure = var _1= SUM(Opportunity[Opportunity count]) +0
var _min = minx(ALLSELECTED('Calendar'), 'Calendar'[Date])
var _max = maxx(ALLSELECTED('Calendar'), 'Calendar'[Date])
return
CALCULATE(if(max('Calendar'[Date]) <_min || max('Calendar'[Date]) >_max , BLANK(), _1))
If you need color on for oct.
the return blank() or white color in else
example
Colour =
SWITCH(TRUE(),
max('Table'[Month]) = "OCT", "red", //loop if or switch if needed
"White")
- Mark as New
- Bookmark
- Subscribe
- Mute
- Subscribe to RSS Feed
- Permalink
- Report Inappropriate Content
Hi,
+0 works for me now, Thank you!
However, I sitll can't put color only on September (sorry not October), because when I applied the color measure to conditioning formatting, it applies to the entire matrix.

Helpful resources

Power BI Dataviz World Championships
The Power BI Data Visualization World Championships is back! Get ahead of the game and start preparing now!

Power BI Monthly Update - November 2025
Check out the November 2025 Power BI update to learn about new features.

| User | Count |
|---|---|
| 65 | |
| 46 | |
| 43 | |
| 26 | |
| 19 |
| User | Count |
|---|---|
| 198 | |
| 126 | |
| 102 | |
| 68 | |
| 51 |


