Get certified for free when you join Fabric Data Days 2026 and dive into Fabric, Power BI, SQL, AI, and other essential data skills.
Join nowJuly 7 - July 17 | Round 2 of the Power BI Dataviz World Championships. Don't miss your chance! Learn more
Hello I have data as follows
Data:
Balance As of Date Data Segregation
10000 2017-06-30 Current
40000 2017-06-30 >1
30000 2017-06-30 Current
20000 2017-06-30 > 2
10000 2017-06-30 Current
10000 2017-06-30 >2
20000 2017-06-30 >2
50000 2017-07-31 Current
10000 2017-07-31 Current
50000 2017-07-31 >1
15000 2017-07-31 >2
50000 2017-07-31 >1
Measures
Current M1 = Calculate( sum(Balance),Filter(Table,table[Data Segregation ] = “Current”
>1 M1 = Calculate( sum(Balance),Filter(Table,table[Data Segregation ] = “> 1”
>2 M1 = Calculate( sum(Balance),Filter(Table,table[Data Segregation ] = “> 2”
Data Display Output
Date Current M1 >1 M1 >2 M1
May sum(Balance) of June
June sum(Balance) of July
July sum(Balance) of Aug
I want to display sum(balance) of next month into current month
How do I acheive this?
Solved! Go to Solution.
Hi @ApurvaKhatri,
Use your sample table to test, get expected result.
1. Create a Calendar Table and build a relatioship from the your Fact Table(named Table2 in my formula) to your Calenda Table.
Calendar = CALENDAR(MIN(Table2[As of Date]),MAX(Table2[As of Date]))
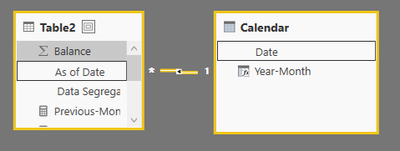
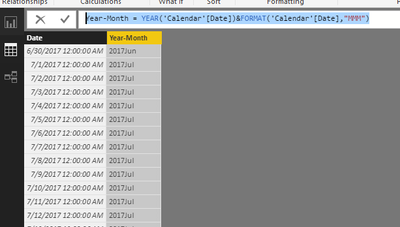
Create calculated column to get Year-Month column using the formula.
Year-Month = YEAR('Calendar'[Date])&FORMAT('Calendar'[Date],"MMM")
2. Create measure using your formula below.
Current M1 =
CALCULATE (
SUM ( Table2[Balance] ),
FILTER ( Table2, Table2[ Data Segregation] = "Current" )
)
>1 M1 =
CALCULATE (
SUM ( Table2[Balance] ),
FILTER ( Table2, Table2[ Data Segregation] = ">1" )
)
>2 M2 =
CALCULATE (
SUM ( Table2[Balance] ),
FILTER ( Table2, Table2[ Data Segregation] = ">2" )
)
Previous-Month CurrentM1 = CALCULATE(Table2[Current M1],NEXTMONTH('Calendar'[Date]))
Previous-Month >1M1 = CALCULATE(Table2[>1 M1],NEXTMONTH('Calendar'[Date]))
Previous-Month >2M2 = CALCULATE(Table2[>2 M2],NEXTMONTH('Calendar'[Date]))
Create a table visual, select the Calendar[Year-Month] and all the measure as values level.
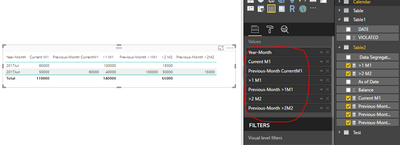
Best Regards,
Angelia
Hi @ApurvaKhatri,
Use your sample table to test, get expected result.
1. Create a Calendar Table and build a relatioship from the your Fact Table(named Table2 in my formula) to your Calenda Table.
Calendar = CALENDAR(MIN(Table2[As of Date]),MAX(Table2[As of Date]))
Create calculated column to get Year-Month column using the formula.
Year-Month = YEAR('Calendar'[Date])&FORMAT('Calendar'[Date],"MMM")
2. Create measure using your formula below.
Current M1 =
CALCULATE (
SUM ( Table2[Balance] ),
FILTER ( Table2, Table2[ Data Segregation] = "Current" )
)
>1 M1 =
CALCULATE (
SUM ( Table2[Balance] ),
FILTER ( Table2, Table2[ Data Segregation] = ">1" )
)
>2 M2 =
CALCULATE (
SUM ( Table2[Balance] ),
FILTER ( Table2, Table2[ Data Segregation] = ">2" )
)
Previous-Month CurrentM1 = CALCULATE(Table2[Current M1],NEXTMONTH('Calendar'[Date]))
Previous-Month >1M1 = CALCULATE(Table2[>1 M1],NEXTMONTH('Calendar'[Date]))
Previous-Month >2M2 = CALCULATE(Table2[>2 M2],NEXTMONTH('Calendar'[Date]))
Create a table visual, select the Calendar[Year-Month] and all the measure as values level.
Best Regards,
Angelia
Hi,
Try this
=CALCULATE(SUM(Data[Balance]),NEXTMONTH(Calendar[Table]))
Hope this helps.
Join us in Barcelona for FabCon and SQLCon, the Fabric, Power BI, SQL, and AI community event. Save €200 with code FABCMTY200.
Join Data Days 2026: 60 days of free live/on-demand sessions, challenges, study groups, and certification opportunities.
| User | Count |
|---|---|
| 29 | |
| 27 | |
| 25 | |
| 23 | |
| 17 |
| User | Count |
|---|---|
| 54 | |
| 46 | |
| 38 | |
| 28 | |
| 21 |