FabCon is coming to Atlanta
Join us at FabCon Atlanta from March 16 - 20, 2026, for the ultimate Fabric, Power BI, AI and SQL community-led event. Save $200 with code FABCOMM.
Register now!- Power BI forums
- Get Help with Power BI
- Desktop
- Service
- Report Server
- Power Query
- Mobile Apps
- Developer
- DAX Commands and Tips
- Custom Visuals Development Discussion
- Health and Life Sciences
- Power BI Spanish forums
- Translated Spanish Desktop
- Training and Consulting
- Instructor Led Training
- Dashboard in a Day for Women, by Women
- Galleries
- Data Stories Gallery
- Themes Gallery
- Contests Gallery
- Quick Measures Gallery
- Visual Calculations Gallery
- Notebook Gallery
- Translytical Task Flow Gallery
- TMDL Gallery
- R Script Showcase
- Webinars and Video Gallery
- Ideas
- Custom Visuals Ideas (read-only)
- Issues
- Issues
- Events
- Upcoming Events
Calling all Data Engineers! Fabric Data Engineer (Exam DP-700) live sessions are back! Starting October 16th. Sign up.
- Power BI forums
- Forums
- Get Help with Power BI
- Desktop
- Re: Power Bi measure showing sum of value in place...
- Subscribe to RSS Feed
- Mark Topic as New
- Mark Topic as Read
- Float this Topic for Current User
- Bookmark
- Subscribe
- Printer Friendly Page
- Mark as New
- Bookmark
- Subscribe
- Mute
- Subscribe to RSS Feed
- Permalink
- Report Inappropriate Content
Power Bi measure showing sum of value in place of count of vale
Hi All,
I have a query :
Select Count(ASSESSMENT.ASSESS_NO) NO_OF_ASSESSMENTS
From ASSESSMENT
where ASSESSMENT.ENTRY_DATE Between '1-Jan-2015' And '31-Dec-2015'
and ASSESSMENT.ASSESS_NO In (Select ASSESSMENT.ASSESS_NEW_ASSESS_NO From ASSESSMENT NEW_ASSESSMENT)
Fo this i have writtren this DAX.
Measure 14 = CALCULATE(COUNT(ASSESSMENT[ASSESS_NO]),'NEW_ASSESSMENT'[Assesssment_New_Flag]="B")
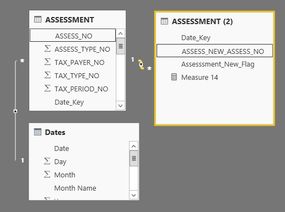
I have created a relation betwenn ASSESS_NO and ASSESS_NEW_ASSESS_NO in power BI.
IN DAX i am calculating ASSESS_NO of ASSESSMENT WHERE Assesssment_New_Flag =B of NEW_ASSESSMENT.
Assesssment_New_Flag is using as flag so that it will take only those record whose value present in NEW_ASSESSMENT.
It is showing data record count 50 .
Measure 14 = CALCULATE(COUNT(ASSESSMENT[ASSESS_NO]),'NEW_ASSESSMENT'[Assesssment_New_Flag]="B")
In original it has to show 20 record count which is right count.
50 is possible when i calculate sum of assess number.
like
Measure 14 = CALCULATE(SUM(ASSESSMENT[ASSESS_NO]),'NEW_ASSESSMENT'[Assesssment_New_Flag]="B")
Power Bi is doing sum of record but in actual it has to count as per my count DAX.
Thanks,
Narender
"
- Mark as New
- Bookmark
- Subscribe
- Mute
- Subscribe to RSS Feed
- Permalink
- Report Inappropriate Content
Hi @Narender,
Due to I could not reprodece your data stracture, I have entered some sample data and it could work on my side.
Sample data:
Create the measure:Measure = CALCULATE(COUNT(ASSESSMENT[ASSESS_NO]),'NEW_ASSESSMENT'[Assesssment_New_Flag]="B")
Now you could see the correct result.
If I misunderstood you, could you please offer me more information about your data structure or share your pbix file if possible?
Regards,
Daniel He
If this post helps, then please consider Accept it as the solution to help the other members find it more quickly.
- Mark as New
- Bookmark
- Subscribe
- Mute
- Subscribe to RSS Feed
- Permalink
- Report Inappropriate Content
Hi Daniel,
Query:
Select Count(ASSESSMENT.ASSESS_NO) NO_OF_ASSESSMENTS From ASSESSMENT where ASSESSMENT.ENTRY_DATE Between '1-Jan-2015' And '31-Dec-2015' and ASSESSMENT.ASSESS_NO In (Select ASSESSMENT.ASSESS_NEW_ASSESS_NO From ASSESSMENT NEW_ASSESSMENT).
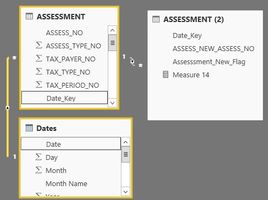
Above are the 4 screen shots ,
1) the replation ship between date_key & date
2) the replation ship access_no & assess_new_assess_no
3) Measure & Assessment & Asessment 2
4) Measure 14 DAX.
Assessment 2 table is copy of table Assessment . In asssment 2, I have removed extra coumns and added 1 column "Assessment_New_Flag" and given value "B".
As per the query , I have added column "Assessment_New_Flag".
I am using this Assessment_New_Flag" in Measure 14.
Please let me know wheter i am doing right and why i am getting worng data .as i am counting the assess_no but it is showing sum of assess_no.
Thanks,
Narender
- Mark as New
- Bookmark
- Subscribe
- Mute
- Subscribe to RSS Feed
- Permalink
- Report Inappropriate Content
Please see this post regarding How to Get Your Question Answered Quickly: https://community.powerbi.com/t5/Community-Blog/How-to-Get-Your-Question-Answered-Quickly/ba-p/38490
Follow on LinkedIn
@ me in replies or I'll lose your thread!!!
Instead of a Kudo, please vote for this idea
Become an expert!: Enterprise DNA
External Tools: MSHGQM
YouTube Channel!: Microsoft Hates Greg
Latest book!: DAX For Humans
DAX is easy, CALCULATE makes DAX hard...
Helpful resources

FabCon Global Hackathon
Join the Fabric FabCon Global Hackathon—running virtually through Nov 3. Open to all skill levels. $10,000 in prizes!

Power BI Monthly Update - October 2025
Check out the October 2025 Power BI update to learn about new features.


