Get certified for free when you join Fabric Data Days 2026 and dive into Fabric, Power BI, SQL, AI, and other essential data skills.
Join nowJuly 7 - July 17 | Round 2 of the Power BI Dataviz World Championships. Don't miss your chance! Learn more
Hi All,
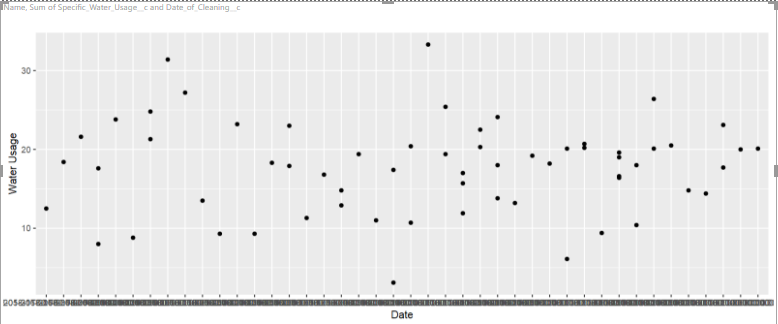
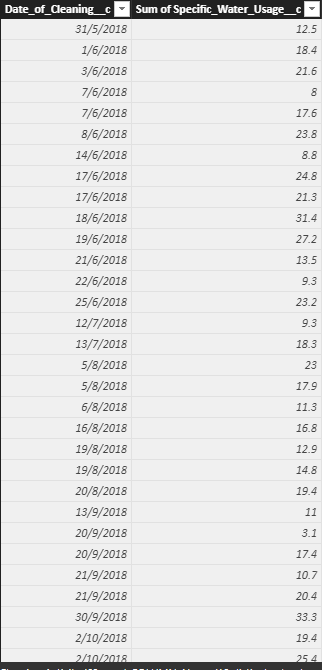
I have two column; Date and Water Usage. I was using ggplot to plot geom_point(), however the date is overlapped each other.
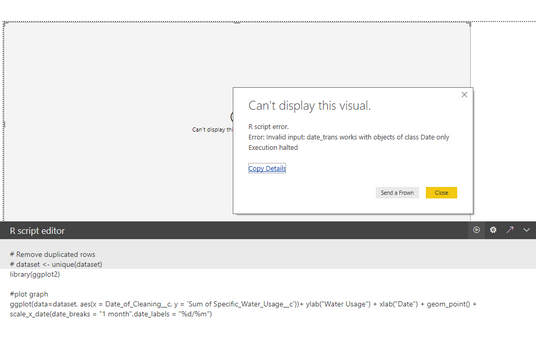
So try to use scale_x_date(date_breaks = "1 month",date_labels = "%b/%y"), however is not working due to the date format.
#date format
dataset$Date_of_Cleaning__c = as.factor(dataset$Date_of_Cleaning__c)
dataset$Date_of_Cleaning__c = as.Date(dataset$Date_of_Cleaning__c,format="%d/%m/%Y")
I did change the date format using the code above, it shows error in seq.int(0, to0 - from, by)...
Anyone can help me to solve this issue?
Hi, I am having excaltly the same error. Is there please any updates/issues for that?
Thanks in adavnce
Hi @Kolumam,
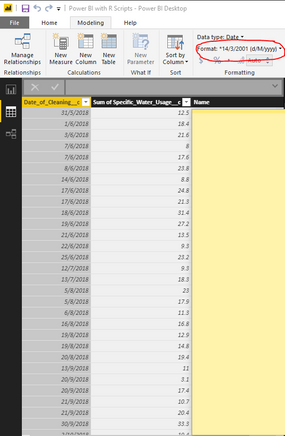
Please check the date format in data view loaded into desktop. Make sure its data type is DAte rather than Date/Time, and check if its format is set to "%d/%m/%Y".
Best regards,
Yuliana Gu
Join us in Barcelona for FabCon and SQLCon, the Fabric, Power BI, SQL, and AI community event. Save €200 with code FABCMTY200.
Join Data Days 2026: 60 days of free live/on-demand sessions, challenges, study groups, and certification opportunities.
| User | Count |
|---|---|
| 28 | |
| 27 | |
| 25 | |
| 23 | |
| 17 |
| User | Count |
|---|---|
| 53 | |
| 46 | |
| 38 | |
| 30 | |
| 21 |