cancel
Showing results for 
Search instead for 
Did you mean: 

July 7 - July 17 | Round 2 of the Power BI Dataviz World Championships. Don't miss your chance! Learn more

Reply
radhikalakshmi
Frequent Visitor

Power BI Matrix Report - Total Incorrect

Hello All,


I am trying to use a matrix visualization to view the count of issues created, updated and in backlog. While trying to retrieve backlog issues, PowerBI does and total of all rows instead of displaying the last value for the month. Could you please help out with this?


MonthCreated CountClosed CountGrowth (Created-Closed)Backlog (formula given below)
(+)February1037current value 13 but it should be 7.
February 13211
February 35145
February 42027


Calculation currently used for backlog column of the table.

" Backlog = CALCULATE(SUM('Table'[Growth]),ALL('Table'), 'Table'[Date] <= EARLIER('Table'[Date]))" 


Can somebody help me how to solve this? 


Thanks in advance!

1 ACCEPTED SOLUTION
Anonymous
Not applicable

Hi @radhikalakshmi ,


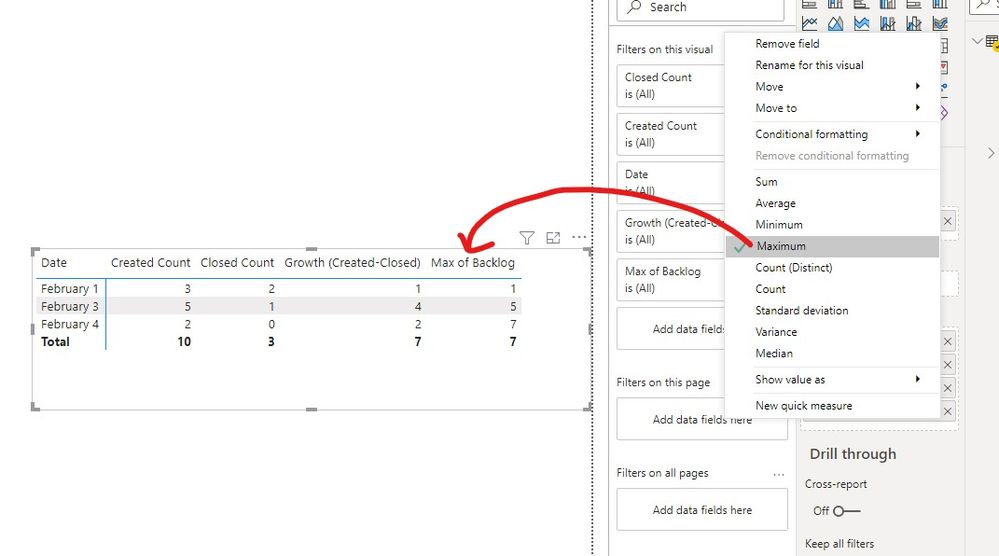
  • Method1——Change the summarization type from Sum to Max like this:

change summarize type from Sum to Max.jpg


  • Method2——Need an additional measure:
Measure based on Backlog column = IF(HASONEVALUE('Table'[Backlog]),MAX('Table'[Backlog]),MAXX(ALL('Table'),[Backlog]))


  • Method3—— Create a measure instead:
Backlog Measure instead of Backlog column = CALCULATE(SUM([Growth (Created-Closed)]),FILTER(ALL('Table'),'Table'[Date]<=MAX('Table'[Date])))

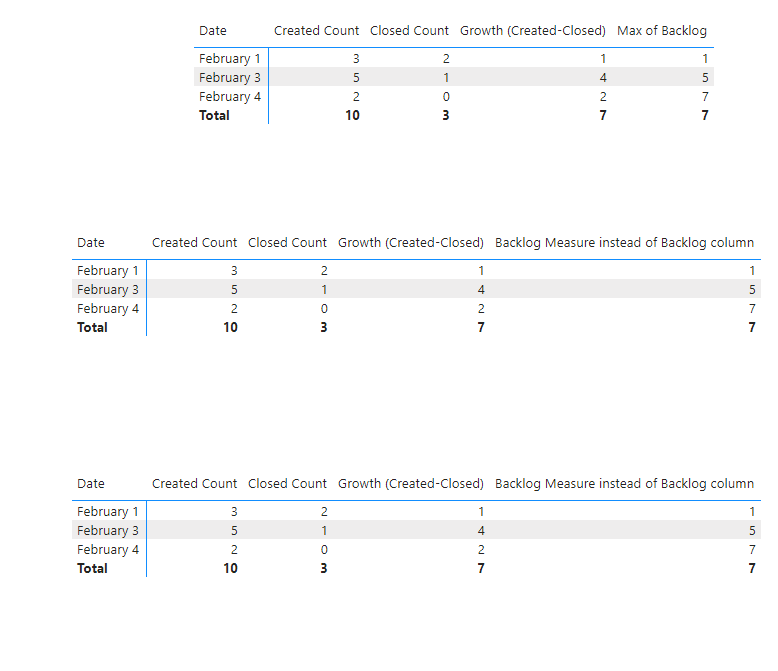
Here is the final output:

chang total field.PNG

Best Regards,
Eyelyn Qin
If this post helps, then please consider Accept it as the solution to help the other members find it more quickly.

View solution in original post

2 REPLIES 2
Anonymous
Not applicable

Hi @radhikalakshmi ,


  • Method1——Change the summarization type from Sum to Max like this:

change summarize type from Sum to Max.jpg


  • Method2——Need an additional measure:
Measure based on Backlog column = IF(HASONEVALUE('Table'[Backlog]),MAX('Table'[Backlog]),MAXX(ALL('Table'),[Backlog]))


  • Method3—— Create a measure instead:
Backlog Measure instead of Backlog column = CALCULATE(SUM([Growth (Created-Closed)]),FILTER(ALL('Table'),'Table'[Date]<=MAX('Table'[Date])))

Here is the final output:

chang total field.PNG

Best Regards,
Eyelyn Qin
If this post helps, then please consider Accept it as the solution to help the other members find it more quickly.

Greg_Deckler
Community Champion
Community Champion

@radhikalakshmi  You need MM3TR&R: Matrix Measure Total Triple Threat Rock & Roll - Microsoft Power BI Community


Follow on LinkedIn
@ me in replies or I'll lose your thread!!!
Instead of a Kudo, please vote for this idea
Become an expert!: Enterprise DNA
External Tools: MSHGQM
YouTube Channel!: Microsoft Hates Greg
Latest book!:
DAX For Humans

DAX is easy, CALCULATE makes DAX hard...

Helpful resources

Announcements
FabCon and SQLCon Barcelona 2026

FabCon & SQLCon – Barcelona 2026

Join us in Barcelona for FabCon and SQLCon, the Fabric, Power BI, SQL, and AI community event. Save €200 with code FABCMTY200.

60 days of Data Days Carousel

Data Days 2026

Join Data Days 2026: 60 days of free live/on-demand sessions, challenges, study groups, and certification opportunities.

Power BI DataViz World Championships carousel

Power BI DataViz World Championships - June 2026

A new Power BI DataViz World Championship is coming this June! Don't miss out on submitting your entry.

Top Solution Authors