Join us at FabCon Vienna from September 15-18, 2025
The ultimate Fabric, Power BI, SQL, and AI community-led learning event. Save €200 with code FABCOMM.
Get registered- Power BI forums
- Get Help with Power BI
- Desktop
- Service
- Report Server
- Power Query
- Mobile Apps
- Developer
- DAX Commands and Tips
- Custom Visuals Development Discussion
- Health and Life Sciences
- Power BI Spanish forums
- Translated Spanish Desktop
- Training and Consulting
- Instructor Led Training
- Dashboard in a Day for Women, by Women
- Galleries
- Data Stories Gallery
- Themes Gallery
- Contests Gallery
- Quick Measures Gallery
- Notebook Gallery
- Translytical Task Flow Gallery
- TMDL Gallery
- R Script Showcase
- Webinars and Video Gallery
- Ideas
- Custom Visuals Ideas (read-only)
- Issues
- Issues
- Events
- Upcoming Events
Enhance your career with this limited time 50% discount on Fabric and Power BI exams. Ends August 31st. Request your voucher.
- Power BI forums
- Forums
- Get Help with Power BI
- Desktop
- Populate a number count of the rows in a table dis...
- Subscribe to RSS Feed
- Mark Topic as New
- Mark Topic as Read
- Float this Topic for Current User
- Bookmark
- Subscribe
- Printer Friendly Page


- Mark as New
- Bookmark
- Subscribe
- Mute
- Subscribe to RSS Feed
- Permalink
- Report Inappropriate Content
Populate a number count of the rows in a table displayed
Hello,
Maybe a stupid question but is there a way to always have a number sort order to each table, meaning when i display some data in a table to always have 1,2,3,4,5, etc. in the beginning of the table. Ideally, not using any rankx functions as i am not ranking anything but simply would like to have the number of rows dispalyed not as a sum but by numbers. Is this possible somehow to be done in Power bi or would need to always add it manually after exporting the file? Please let me know, thanks.
Example if i now have this:
| Text | Text | Text | Text |
| Value | Value | Value | Value |
| Value | Value | Value | Value |
| Value | Value | Value | Value |
What i would like ideally to have is:
| Number | Text | Text | Text | Text |
| 1 | Value | Value | Value | Value |
| 2 | Value | Value | Value | Value |
| 3 | Value | Value | Value | Value |
Solved! Go to Solution.


- Mark as New
- Bookmark
- Subscribe
- Mute
- Subscribe to RSS Feed
- Permalink
- Report Inappropriate Content
Hi, try this:
1. Add a Index Column in Power Query
2. Create a measure
indexdinamyc =
VAR index =
    SELECTEDVALUE ( 'Table (2)'[Index] )
RETURN
    COUNTROWS (
        FILTER ( ALLSELECTED ( 'Table (2)' ); 'Table (2)'[Index] <= index )
    )
3. Add this measure in your visual table
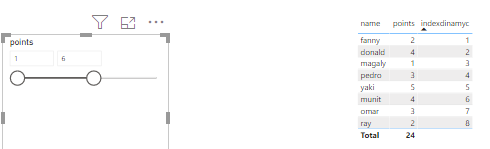
Note: Maybe is you use aggregations this need some extra adjustments.
Regards
Victor
Lima - Peru
- Mark as New
- Bookmark
- Subscribe
- Mute
- Subscribe to RSS Feed
- Permalink
- Report Inappropriate Content
Hi, try this:
1. Add a Index Column in Power Query
2. Create a measure
indexdinamyc =
VAR index =
    SELECTEDVALUE ( 'Table (2)'[Index] )
RETURN
    COUNTROWS (
        FILTER ( ALLSELECTED ( 'Table (2)' ); 'Table (2)'[Index] <= index )
    )
3. Add this measure in your visual table
Note: Maybe is you use aggregations this need some extra adjustments.
Regards
Victor
Lima - Peru
- Mark as New
- Bookmark
- Subscribe
- Mute
- Subscribe to RSS Feed
- Permalink
- Report Inappropriate Content
That seemed to work for me thank you.


- Mark as New
- Bookmark
- Subscribe
- Mute
- Subscribe to RSS Feed
- Permalink
- Report Inappropriate Content
Hi,
You can easily add an index column to your model.
In Power Query, use on the tab Add Column, the Button Index Column.
It should do the trick,
- Mark as New
- Bookmark
- Subscribe
- Mute
- Subscribe to RSS Feed
- Permalink
- Report Inappropriate Content
Thank you for the quick reply @AilleryO , sorry, maybe one point that i forgot to mention is, i will filter the values, therefore it wil not be the order of how they are in the data. So unfortuantely, index will not do the trick as it will display the number as the way the data was loaded. It will need to be dynamic, but the only way i know is using a rankx measure, but i was wondering if there was some dynamic indexing in the tables.
- Mark as New
- Bookmark
- Subscribe
- Mute
- Subscribe to RSS Feed
- Permalink
- Report Inappropriate Content
Hi,
You're welcome.
And the COUNTROWS function is not of any help in your case ?
Have a nice day
- Mark as New
- Bookmark
- Subscribe
- Mute
- Subscribe to RSS Feed
- Permalink
- Report Inappropriate Content
No unfortuntely, it doesnt seem to be working for me.
- Mark as New
- Bookmark
- Subscribe
- Mute
- Subscribe to RSS Feed
- Permalink
- Report Inappropriate Content
And :
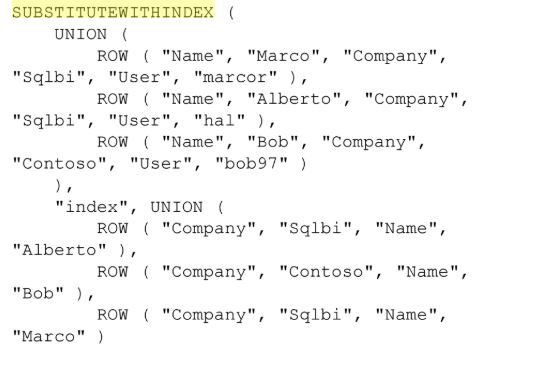
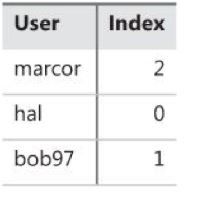
SUBSITUTEWITHINDEX so you can already select your data, and then INDEX them ?
- Mark as New
- Bookmark
- Subscribe
- Mute
- Subscribe to RSS Feed
- Permalink
- Report Inappropriate Content
With this solution i think i will need to define the index 1 by 1 in my undertanding of how it works.
- Mark as New
- Bookmark
- Subscribe
- Mute
- Subscribe to RSS Feed
- Permalink
- Report Inappropriate Content
Hi,
Isn't it possible for you to create a calculated column ?
before using SUBSTITUTEWITHINDEX, to lessen the possibilities...
- Mark as New
- Bookmark
- Subscribe
- Mute
- Subscribe to RSS Feed
- Permalink
- Report Inappropriate Content
No, i dont think so. I think since there doesnt seem to be a function or feature that supports this at the moment in Power Bi, for my case the easiest way would be then to use a rankx function and rank a single value column.


- Mark as New
- Bookmark
- Subscribe
- Mute
- Subscribe to RSS Feed
- Permalink
- Report Inappropriate Content
Hi,
As far as i have known, i think there is no such function expect using ranking measure to show dynamical index.
And i think what you said is a cool idea, you can create an idea here:
https://ideas.powerbi.com/forums/265200-power-bi-ideas
Best Regards,
Giotto Zhi

Helpful resources

Power BI Monthly Update - August 2025
Check out the August 2025 Power BI update to learn about new features.

Fabric Community Update - August 2025
Find out what's new and trending in the Fabric community.


| User | Count |
|---|---|
| 79 | |
| 71 | |
| 70 | |
| 63 | |
| 42 |


