Get certified for free when you join Fabric Data Days 2026 and dive into Fabric, Power BI, SQL, AI, and other essential data skills.
Join nowJuly 7 - July 17 | Round 2 of the Power BI Dataviz World Championships. Don't miss your chance! Learn more
Hi,
I am just wondering how i can export performance analyzer data to excel.
I have tried to export as json, connect to power bi, and then exported to excel,but my json does not contain Duration (ms) column,,, only evenst start and events end columns... is that right ?
How to approach that to have duration values available as well ? do i have to prepare a measures or is there easier way to xptrac those data in excel format ?
Thanks in advance!
Hi @Kopek ,
Export date gives you the ability to export entire tables from your data model to either CSV files or to SQL Server.
For more details, you can read related document:
Best Regards,
Henry
If this post helps, then please consider Accept it as the solution to help the other members find it more quickly.
Hi
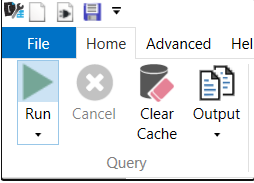
I use "DAX Studio" not only to export data into excel but also performance tuning.
Just explore "DAX Studio".
Appreciate a Kudos! 🙂
If this helps and resolves the issue, please mark it as a Solution! 🙂
Regards,
N V Durga Prasad
Hi,
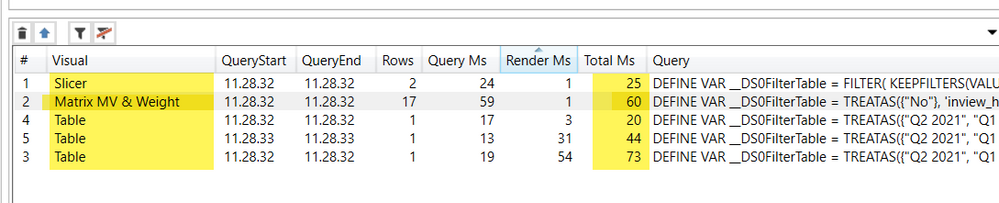
I have download the DAX Studio, but i am not able to eport data to excel, it's just exporting the code, whereas i need to export data highlighet in yellow, so vizualization name and duration (ms), can you guide me how to do that, please:
Join us in Barcelona for FabCon and SQLCon, the Fabric, Power BI, SQL, and AI community event. Save €200 with code FABCMTY200.
Join Data Days 2026: 60 days of free live/on-demand sessions, challenges, study groups, and certification opportunities.
| User | Count |
|---|---|
| 29 | |
| 27 | |
| 25 | |
| 22 | |
| 18 |
| User | Count |
|---|---|
| 52 | |
| 47 | |
| 43 | |
| 36 | |
| 33 |