Party with Power BI’s own Guy in a Cube
Power BI is turning 10! Tune in for a special live episode on July 24 with behind-the-scenes stories, product evolution highlights, and a sneak peek at what’s in store for the future.
Save the date- Power BI forums
- Get Help with Power BI
- Desktop
- Service
- Report Server
- Power Query
- Mobile Apps
- Developer
- DAX Commands and Tips
- Custom Visuals Development Discussion
- Health and Life Sciences
- Power BI Spanish forums
- Translated Spanish Desktop
- Training and Consulting
- Instructor Led Training
- Dashboard in a Day for Women, by Women
- Galleries
- Data Stories Gallery
- Themes Gallery
- Contests Gallery
- Quick Measures Gallery
- Notebook Gallery
- Translytical Task Flow Gallery
- TMDL Gallery
- R Script Showcase
- Webinars and Video Gallery
- Ideas
- Custom Visuals Ideas (read-only)
- Issues
- Issues
- Events
- Upcoming Events
Enhance your career with this limited time 50% discount on Fabric and Power BI exams. Ends August 31st. Request your voucher.
- Power BI forums
- Forums
- Get Help with Power BI
- Desktop
- Re: Percent of Total for Week (calculations not gi...
- Subscribe to RSS Feed
- Mark Topic as New
- Mark Topic as Read
- Float this Topic for Current User
- Bookmark
- Subscribe
- Printer Friendly Page
- Mark as New
- Bookmark
- Subscribe
- Mute
- Subscribe to RSS Feed
- Permalink
- Report Inappropriate Content
Percent of Total for Week (calculations not giving expected answer)
Hi all,
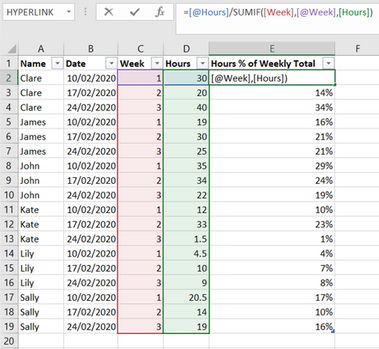
I have a table called Timesheet Reports, like this:
| Name | Date | Week | Hours |
| Clare | 10/02/2020 | 1 | 30 |
| Clare | 17/02/2020 | 2 | 20 |
| Clare | 24/02/2020 | 3 | 40 |
| James | 10/02/2020 | 1 | 19 |
| James | 17/02/2020 | 2 | 30 |
| James | 24/02/2020 | 3 | 25 |
| John | 10/02/2020 | 1 | 35 |
| John | 17/02/2020 | 2 | 34 |
| John | 24/02/2020 | 3 | 22 |
| Kate | 10/02/2020 | 1 | 12 |
| Kate | 17/02/2020 | 2 | 33 |
| Kate | 24/02/2020 | 3 | 1.5 |
| Lily | 10/02/2020 | 1 | 4.5 |
| Lily | 17/02/2020 | 2 | 10 |
| Lily | 24/02/2020 | 3 | 9 |
| Sally | 10/02/2020 | 1 | 20.5 |
| Sally | 17/02/2020 | 2 | 14 |
| Sally | 24/02/2020 | 3 | 19 |
Note that the week is calculated using a look up from another table called Dates:
I want another column that calculates the percentage of total hours per week, i.e.:
E.g. for the last line hours is 19, the week number is 3, and sum of hours for week 3 in this table is 116.5.
So for that row we do 19/116.5 = 16.3%.
What's the best formula for this in Power BI?
Note that I have filters on the page for week number. So we only ever view 1 week at a time.
I've tried using this measure:
- Mark as New
- Bookmark
- Subscribe
- Mute
- Subscribe to RSS Feed
- Permalink
- Report Inappropriate Content
hi @Erf19
You may try to adjust measure Total Hours for Week Selected as below:
Total Hours for Week Selected = CALCULATE(SUM('Timesheet Reports'[Hours]),ALLSELECTED('Timesheet Reports'))
Then it should work well.
Regards,
Lin
If this post helps, then please consider Accept it as the solution to help the other members find it more quickly.
- Mark as New
- Bookmark
- Subscribe
- Mute
- Subscribe to RSS Feed
- Permalink
- Report Inappropriate Content
sorry, this doesn't seem to work either
- Mark as New
- Bookmark
- Subscribe
- Mute
- Subscribe to RSS Feed
- Permalink
- Report Inappropriate Content
hi @Erf19
Please share your sample pbix file and expected output, it would be a great help.
https://community.powerbi.com/t5/Community-Blog/How-to-Get-Your-Question-Answered-Quickly/ba-p/38490...
Regards,
Lin
If this post helps, then please consider Accept it as the solution to help the other members find it more quickly.
- Mark as New
- Bookmark
- Subscribe
- Mute
- Subscribe to RSS Feed
- Permalink
- Report Inappropriate Content
Try to use
Total Hours for Week level = CALCULATE(SUM('Timesheet Reports'[Hours]),allexcept('Timesheet Reports'[Financial Week]))
refer:
https://community.powerbi.com/t5/Desktop/calculate-category-total-in-table-visualization/td-p/519340
https://community.powerbi.com/t5/Desktop/highest-value-by-category/td-p/428758
Appreciate your Kudos. In case, this is the solution you are looking for, mark it as the Solution. In case it does not help, please provide additional information and mark me with @
Thanks. My Recent Blog -
Winner-Topper-on-Map-How-to-Color-States-on-a-Map-with-Winners , HR-Analytics-Active-Employee-Hire-and-Termination-trend
Power-BI-Working-with-Non-Standard-Time-Periods And Comparing-Data-Across-Date-Ranges
Connect on Linkedin
- Mark as New
- Bookmark
- Subscribe
- Mute
- Subscribe to RSS Feed
- Permalink
- Report Inappropriate Content
Hi, thanks for your response.
I just tried this. First got an error about number of arguments in 'allexcept' so I changed it to:
Helpful resources
| User | Count |
|---|---|
| 77 | |
| 75 | |
| 46 | |
| 31 | |
| 28 |
| User | Count |
|---|---|
| 99 | |
| 93 | |
| 50 | |
| 49 | |
| 46 |


