- Power BI forums
- Updates
- News & Announcements
- Get Help with Power BI
- Desktop
- Service
- Report Server
- Power Query
- Mobile Apps
- Developer
- DAX Commands and Tips
- Custom Visuals Development Discussion
- Health and Life Sciences
- Power BI Spanish forums
- Translated Spanish Desktop
- Power Platform Integration - Better Together!
- Power Platform Integrations (Read-only)
- Power Platform and Dynamics 365 Integrations (Read-only)
- Training and Consulting
- Instructor Led Training
- Dashboard in a Day for Women, by Women
- Galleries
- Community Connections & How-To Videos
- COVID-19 Data Stories Gallery
- Themes Gallery
- Data Stories Gallery
- R Script Showcase
- Webinars and Video Gallery
- Quick Measures Gallery
- 2021 MSBizAppsSummit Gallery
- 2020 MSBizAppsSummit Gallery
- 2019 MSBizAppsSummit Gallery
- Events
- Ideas
- Custom Visuals Ideas
- Issues
- Issues
- Events
- Upcoming Events
- Community Blog
- Power BI Community Blog
- Custom Visuals Community Blog
- Community Support
- Community Accounts & Registration
- Using the Community
- Community Feedback
Register now to learn Fabric in free live sessions led by the best Microsoft experts. From Apr 16 to May 9, in English and Spanish.
- Power BI forums
- Forums
- Get Help with Power BI
- Desktop
- Need to subtract two matrix values to populate a t...
- Subscribe to RSS Feed
- Mark Topic as New
- Mark Topic as Read
- Float this Topic for Current User
- Bookmark
- Subscribe
- Printer Friendly Page
- Mark as New
- Bookmark
- Subscribe
- Mute
- Subscribe to RSS Feed
- Permalink
- Report Inappropriate Content
Need to subtract two matrix values to populate a third visual in Power BI Desktop
I am new to Power BI desktop and DAX so I need a bit of help with a problem.
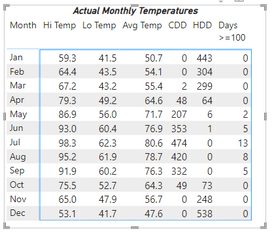
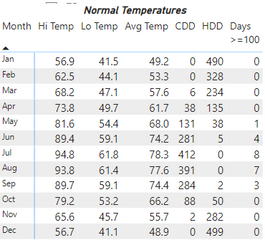
I have two matrix visuals in a monthly page that reflect average monthly temperatures.
The underlying data that populates the Actual Monthly Temperatures matrix is stored in a table containing daily temperatures (raw data). The data in the Normal Temperatures matrix is stored in a separate table and is already aggregated (these are averaged values).
I need to calculate the monthly value for above or below normal for each column shown in each matrix for a third visual depicting temperatures above or below normal. In other words for January: 55.9 - 58.3 = 2.7 (for HiTemp) , 39.0-39.2 = -.2 (for LoTemp) etc.
I understand that I can aggregate the daily data in a measure, but I am not sure how to subtract a regular column value from a separate table (Normal Temperatures - values already aggregated) from a measure.
Any help would be greatly appreciated!
****UPDATE****
This issue was resolved by updating the underlying model to create a date table and a dimension table for the month value as this was the only column that the aggregated and unaggregated data had in common. After creating proper relationships, measures calculating totals were created.
@TheoC Thank you for your time!
- Mark as New
- Bookmark
- Subscribe
- Mute
- Subscribe to RSS Feed
- Permalink
- Report Inappropriate Content
Apologies Theo, yes January would be 56.9-59.3= -2.4 Hi Temp, 41.5-41.5=0 for Lo temp etc. I think when I listed the values I had sliced the data to a separate weather station and those were the values I had in the text.
- Mark as New
- Bookmark
- Subscribe
- Mute
- Subscribe to RSS Feed
- Permalink
- Report Inappropriate Content
Hi @CMccown
Thanks for letting me know.
Can you provide answers to the other questions as well please?
Thanks,
Theo
If I have posted a response that resolves your question, please accept it as a solution to formally close the post.
Also, if you are as passionate about Power BI, DAX and data as I am, please feel free to reach out if you have any questions, queries, or if you simply want to connect and talk to another data geek!
Want to connect?www.linkedin.com/in/theoconias
- Mark as New
- Bookmark
- Subscribe
- Mute
- Subscribe to RSS Feed
- Permalink
- Report Inappropriate Content
Hi @CMccown
I'm trying to better understand your data. You've listed January as 55.9 - 58.3 = 2.7 (for HiTemp) however January has 59.3 and 56.9 per the diagrams. Or is it that I have completely misunderstood where the figures have come from? If I haven't, does that mean that the 2.7 should be 2.4? Similarly, Lo Temp for January in the diagrams is 41.5 and 41.5 - but again, I may have misunderstood where these numbers are coming from.
A few other questions before I can provide a solution:
- Do you have a Date table established in your data model?
- If there is no Date table, is there a relationship between the two sets of data? If so, what is the relationship?
- Can you provide your data sets or some dummy data?
Many thanks and look forward to hearing from you soon!
Theo 🙂
If I have posted a response that resolves your question, please accept it as a solution to formally close the post.
Also, if you are as passionate about Power BI, DAX and data as I am, please feel free to reach out if you have any questions, queries, or if you simply want to connect and talk to another data geek!
Want to connect?www.linkedin.com/in/theoconias
- Mark as New
- Bookmark
- Subscribe
- Mute
- Subscribe to RSS Feed
- Permalink
- Report Inappropriate Content
Hi Theo,
Below are two screen shots, one of the model and one of the data for the Normal table, just to show how the dates for Normal are presented, they are cumulative for the time period. I do not have a date table and the relationship I have is by month.
Thank you again for your time.
Candace
Helpful resources

Microsoft Fabric Learn Together
Covering the world! 9:00-10:30 AM Sydney, 4:00-5:30 PM CET (Paris/Berlin), 7:00-8:30 PM Mexico City

Power BI Monthly Update - April 2024
Check out the April 2024 Power BI update to learn about new features.

| User | Count |
|---|---|
| 109 | |
| 99 | |
| 83 | |
| 76 | |
| 65 |
| User | Count |
|---|---|
| 120 | |
| 108 | |
| 95 | |
| 83 | |
| 77 |


