- Power BI forums
- Updates
- News & Announcements
- Get Help with Power BI
- Desktop
- Service
- Report Server
- Power Query
- Mobile Apps
- Developer
- DAX Commands and Tips
- Custom Visuals Development Discussion
- Health and Life Sciences
- Power BI Spanish forums
- Translated Spanish Desktop
- Power Platform Integration - Better Together!
- Power Platform Integrations (Read-only)
- Power Platform and Dynamics 365 Integrations (Read-only)
- Training and Consulting
- Instructor Led Training
- Dashboard in a Day for Women, by Women
- Galleries
- Community Connections & How-To Videos
- COVID-19 Data Stories Gallery
- Themes Gallery
- Data Stories Gallery
- R Script Showcase
- Webinars and Video Gallery
- Quick Measures Gallery
- 2021 MSBizAppsSummit Gallery
- 2020 MSBizAppsSummit Gallery
- 2019 MSBizAppsSummit Gallery
- Events
- Ideas
- Custom Visuals Ideas
- Issues
- Issues
- Events
- Upcoming Events
- Community Blog
- Power BI Community Blog
- Custom Visuals Community Blog
- Community Support
- Community Accounts & Registration
- Using the Community
- Community Feedback
Register now to learn Fabric in free live sessions led by the best Microsoft experts. From Apr 16 to May 9, in English and Spanish.
- Power BI forums
- Forums
- Get Help with Power BI
- Desktop
- Need to apply productx calculation after applying ...
- Subscribe to RSS Feed
- Mark Topic as New
- Mark Topic as Read
- Float this Topic for Current User
- Bookmark
- Subscribe
- Printer Friendly Page
- Mark as New
- Bookmark
- Subscribe
- Mute
- Subscribe to RSS Feed
- Permalink
- Report Inappropriate Content
Need to apply productx calculation after applying a filter based on a measure value
Hi Team,
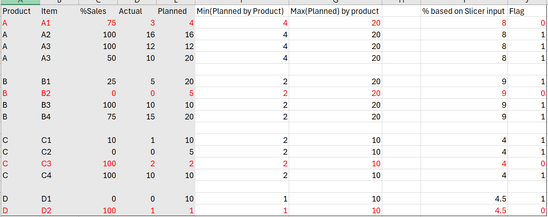
I have a requirement to create Product wise Sale% based on Itemwise Sale% under each product .
Please see the below Screenshot . Actual , Planned and % Sales are measures .
Now I have a Range slicer which shows value 1 to 100 . I can change this value when needed . For now, I selected value as 50
Now, I am finding out % based on slicer value by calculating Minimum and maximum Item value of actual and Planned for each product and multiply with this slicer value
example
I am creating a Flag, If Planned< % Based on Slicer Input then updating it as 0(zero) this record has to be excluded from Productwise Sales% calculation
Productwise % Sales= product of %sales of each item
ex. For Product A Sale% = 100*100*50 . 75 excluded for calculation
Product B %Sales= 25*100*75 . 0 excluded for calculation.Similary for Product C Sales %= 10*0*100 , Product D Sale%= 0
I Hope you got the requirement . Appreciate your valuable inputs
Solved! Go to Solution.
- Mark as New
- Bookmark
- Subscribe
- Mute
- Subscribe to RSS Feed
- Permalink
- Report Inappropriate Content
@dk_powerbiuser1 So, maybe this:
  VAR __Product = MAX('Table'[Product])
  VAR __Table =
    FILTER(
      SUMMARIZE(
        FILTER( ALL('Table'), [Product] = __Product ),
        [Product],
        [Item],
        "__%Sales", [%Sales],
        "__Flag", [Flag]
      ),
      [__Flag] > 0
    )
  VAR __Result = PRODUCTX( __Table, [__%Sales] )
RETURN
  __Result
Basically, the measure aggregation pattern. This looks like a measure aggregation problem. See my blog article about that here: https://community.powerbi.com/t5/Community-Blog/Design-Pattern-Groups-and-Super-Groups/ba-p/138149
The pattern is:
MinScoreMeasure = MINX ( SUMMARIZE ( Table, Table[Group] , "Measure",[YourMeasure] ), [Measure])
MaxScoreMeasure = MAXX ( SUMMARIZE ( Table, Table[Group] , "Measure",[YourMeasure] ), [Measure])
AvgScoreMeasure = AVERAGEX ( SUMMARIZE ( Table, Table[Group] , "Measure",[YourMeasure] ), [Measure])
etc.
@ me in replies or I'll lose your thread!!!
Instead of a Kudo, please vote for this idea
Become an expert!: Enterprise DNA
External Tools: MSHGQM
YouTube Channel!: Microsoft Hates Greg
Latest book!: The Definitive Guide to Power Query (M)
DAX is easy, CALCULATE makes DAX hard...
Helpful resources

Microsoft Fabric Learn Together
Covering the world! 9:00-10:30 AM Sydney, 4:00-5:30 PM CET (Paris/Berlin), 7:00-8:30 PM Mexico City

Power BI Monthly Update - April 2024
Check out the April 2024 Power BI update to learn about new features.

| User | Count |
|---|---|
| 98 | |
| 96 | |
| 75 | |
| 71 | |
| 64 |
| User | Count |
|---|---|
| 143 | |
| 109 | |
| 103 | |
| 82 | |
| 74 |


