FabCon is coming to Atlanta
Join us at FabCon Atlanta from March 16 - 20, 2026, for the ultimate Fabric, Power BI, AI and SQL community-led event. Save $200 with code FABCOMM.
Register now!- Power BI forums
- Get Help with Power BI
- Desktop
- Service
- Report Server
- Power Query
- Mobile Apps
- Developer
- DAX Commands and Tips
- Custom Visuals Development Discussion
- Health and Life Sciences
- Power BI Spanish forums
- Translated Spanish Desktop
- Training and Consulting
- Instructor Led Training
- Dashboard in a Day for Women, by Women
- Galleries
- Data Stories Gallery
- Themes Gallery
- Contests Gallery
- Quick Measures Gallery
- Notebook Gallery
- Translytical Task Flow Gallery
- TMDL Gallery
- R Script Showcase
- Webinars and Video Gallery
- Ideas
- Custom Visuals Ideas (read-only)
- Issues
- Issues
- Events
- Upcoming Events
To celebrate FabCon Vienna, we are offering 50% off select exams. Ends October 3rd. Request your discount now.
- Power BI forums
- Forums
- Get Help with Power BI
- Desktop
- Re: Need help with grouping by filtering contains
- Subscribe to RSS Feed
- Mark Topic as New
- Mark Topic as Read
- Float this Topic for Current User
- Bookmark
- Subscribe
- Printer Friendly Page
- Mark as New
- Bookmark
- Subscribe
- Mute
- Subscribe to RSS Feed
- Permalink
- Report Inappropriate Content
Need help with grouping by filtering contains
I am fairly new to Power BI, I have imported some data to power BI and I am able to get data in tabular format like below (Current Output). I want to filer/ group data and generate a report that gives the details as shared below in required output.
Current Output
Name Cost
Entity1_Var1 10
Entity1_Var2 15
Entity1_Var3 5
Entity2_Var4 20
Entity2_Var5 15
Required Output
Name Cost
Entity1 30
Entity2 35
Solved! Go to Solution.
- Mark as New
- Bookmark
- Subscribe
- Mute
- Subscribe to RSS Feed
- Permalink
- Report Inappropriate Content
Hi @Anonymous ,
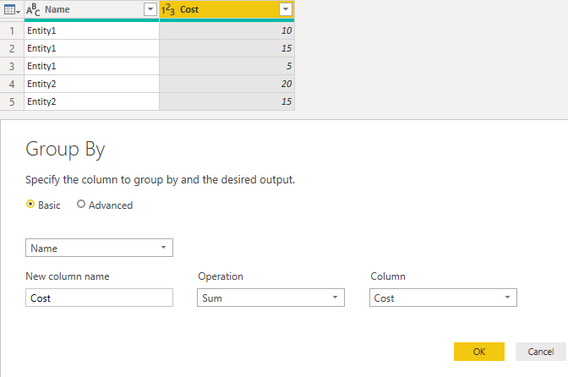
transform your data this way...
Regards,
Marcus
Dortmund - Germany
If I answered your question, please mark my post as solution, this will also help others.
Please give Kudos for support.
Please mark my post as solution, this will also help others.
Please give Kudos for support.
Marcus Wegener works as Full Stack Power BI Engineer at BI or DIE.
His mission is clear: "Get the most out of data, with Power BI."
twitter - LinkedIn - YouTube - website - podcast - Power BI Tutorials
- Mark as New
- Bookmark
- Subscribe
- Mute
- Subscribe to RSS Feed
- Permalink
- Report Inappropriate Content
@Anonymous ,
Clicl Query editor-> Transform-> Split Columns as below:

After remove the useless column, click Transform-> Group by as below:

The final result will be like below:

You can refer to the pbix file.
Community Support Team _ Jimmy Tao
If this post helps, then please consider Accept it as the solution to help the other members find it more quickly.
- Mark as New
- Bookmark
- Subscribe
- Mute
- Subscribe to RSS Feed
- Permalink
- Report Inappropriate Content
Thanks alot this helps!
- Mark as New
- Bookmark
- Subscribe
- Mute
- Subscribe to RSS Feed
- Permalink
- Report Inappropriate Content
You can create new column
new Col =left(table[Name],(len(table[Name])-search(table[Name],"_")))
In table or matrix, now you can use new table and sum Agg with cost.
Appreciate your Kudos. In case, this is the solution you are looking for, mark it as the Solution. In case it does not help, please provide additional information and mark me with @
Thanks. My Recent Blog -
https://community.powerbi.com/t5/Community-Blog/Winner-Topper-on-Map-How-to-Color-States-on-a-Map-wi...
https://community.powerbi.com/t5/Community-Blog/HR-Analytics-Active-Employee-Hire-and-Termination-tr...
https://community.powerbi.com/t5/Community-Blog/Power-BI-Working-with-Non-Standard-Time-Periods/ba-p...
https://community.powerbi.com/t5/Community-Blog/Comparing-Data-Across-Date-Ranges/ba-p/823601
- Mark as New
- Bookmark
- Subscribe
- Mute
- Subscribe to RSS Feed
- Permalink
- Report Inappropriate Content
Thanks Amit for your help, appreciate it!
- Mark as New
- Bookmark
- Subscribe
- Mute
- Subscribe to RSS Feed
- Permalink
- Report Inappropriate Content
Hi @Anonymous ,
transform your data this way...
Regards,
Marcus
Dortmund - Germany
If I answered your question, please mark my post as solution, this will also help others.
Please give Kudos for support.
Please mark my post as solution, this will also help others.
Please give Kudos for support.
Marcus Wegener works as Full Stack Power BI Engineer at BI or DIE.
His mission is clear: "Get the most out of data, with Power BI."
twitter - LinkedIn - YouTube - website - podcast - Power BI Tutorials
- Mark as New
- Bookmark
- Subscribe
- Mute
- Subscribe to RSS Feed
- Permalink
- Report Inappropriate Content
Thank you Marcus, this was exactly what I was looking for.
Appreciate your effrots and time!


