FabCon is coming to Atlanta
Join us at FabCon Atlanta from March 16 - 20, 2026, for the ultimate Fabric, Power BI, AI and SQL community-led event. Save $200 with code FABCOMM.
Register now!- Power BI forums
- Get Help with Power BI
- Desktop
- Service
- Report Server
- Power Query
- Mobile Apps
- Developer
- DAX Commands and Tips
- Custom Visuals Development Discussion
- Health and Life Sciences
- Power BI Spanish forums
- Translated Spanish Desktop
- Training and Consulting
- Instructor Led Training
- Dashboard in a Day for Women, by Women
- Galleries
- Data Stories Gallery
- Themes Gallery
- Contests Gallery
- QuickViz Gallery
- Quick Measures Gallery
- Visual Calculations Gallery
- Notebook Gallery
- Translytical Task Flow Gallery
- TMDL Gallery
- R Script Showcase
- Webinars and Video Gallery
- Ideas
- Custom Visuals Ideas (read-only)
- Issues
- Issues
- Events
- Upcoming Events
The Power BI Data Visualization World Championships is back! Get ahead of the game and start preparing now! Learn more
- Power BI forums
- Forums
- Get Help with Power BI
- Desktop
- Re: Need Help with Line Chart Aggregation Issue: T...
- Subscribe to RSS Feed
- Mark Topic as New
- Mark Topic as Read
- Float this Topic for Current User
- Bookmark
- Subscribe
- Printer Friendly Page
- Mark as New
- Bookmark
- Subscribe
- Mute
- Subscribe to RSS Feed
- Permalink
- Report Inappropriate Content
Need Help with Line Chart Aggregation Issue: Two DAX Measures Result in Enormous Values
Hello all,
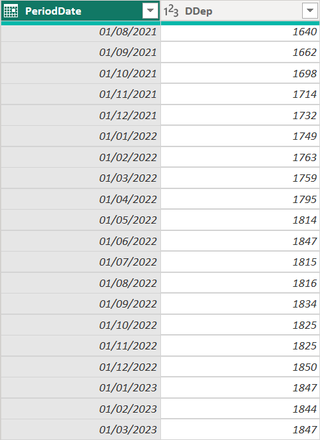
I have the table displayed below which represents the data I want to show on a line graph, the desired outcome is to have two lines, one for the current rolling 12 months, and another for the prior rolling 12 months. I have created the following DAX measures to display the line charts displayed below. The problem I have here is that the values aggregate in an enormous manner over the graph periods, and I can't figure out why this is happening.
For info, I have a date table named "Calendrier" which is set as the default date table, and the PeriodDate starts from Jan 2021.
I really appreciate your assistance
Thank you
- Mark as New
- Bookmark
- Subscribe
- Mute
- Subscribe to RSS Feed
- Permalink
- Report Inappropriate Content
Hi @Anonymous ,
According to your description, here are my steps you can follow as a solution.
(1)My test data is the same as yours.
(2) We can create two measures.
Rolling ddep  current 12 month =
CALCULATE (
    SUM ( AMD[Ddep] ),
    DATESBETWEEN (
        'Calendrier'[Date],
        EDATE ( MIN ( 'Calendrier'[Date] ), -11 ),
        MAX ( 'Calendrier'[Date] )
    )
)
Rolling ddep for previous 12 months =
CALCULATE (
    SUM ( 'AMD'[Ddep] ),
    DATESBETWEEN (
        'Calendrier'[Date],
        EDATE ( MIN ( 'Calendrier'[Date] ), -23 ),
        EDATE ( MAX ( 'Calendrier'[Date] ), -12 )
    )
)
(3) Then the result is as follows.
If the above one can't help you get the desired result, please provide some sample data in your tables (exclude sensitive data) with Text format and your expected result with backend logic and special examples. It is better if you can share a simplified pbix file. Thank you.
Best Regards,
Neeko Tang
If this post helps, then please consider Accept it as the solution to help the other members find it more quickly.
- Mark as New
- Bookmark
- Subscribe
- Mute
- Subscribe to RSS Feed
- Permalink
- Report Inappropriate Content
Hello @Anonymous , sorry the late response, I tested many times but still getting the undersider result please find below the link for the Power BI file related to this issue: https://drive.google.com/file/d/1-u6GF_cygXVfBhzMIRmdOVlZWlfk-_Xt/view?usp=share_link
This is an example of the desired outcome:
- Mark as New
- Bookmark
- Subscribe
- Mute
- Subscribe to RSS Feed
- Permalink
- Report Inappropriate Content
Hi @Anonymous ,
Please try:
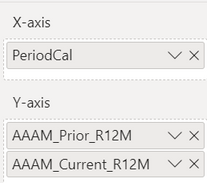
AAAM_Current_R12M =

CALCULATE(SUM('Sales deployed per full month'[Sales Deployed]),FILTER(ALL(DateTable),[Date]>=EOMONTH(MAX('DateTable'[Date]),-11)&&[Date]<=EOMONTH(MAX('DateTable'[Date]),0)))
AAAM_Prior_R12M =
CALCULATE(SUM('Sales deployed per full month'[Sales Deployed]),FILTER(ALL(DateTable),[Date]>=EOMONTH(MAX('DateTable'[Date]),-23)&&[Date]<=EOMONTH(MAX('DateTable'[Date]),-11)))Best Regards,
Neeko Tang
If this post helps, then please consider Accept it as the solution to help the other members find it more quickly.
- Mark as New
- Bookmark
- Subscribe
- Mute
- Subscribe to RSS Feed
- Permalink
- Report Inappropriate Content
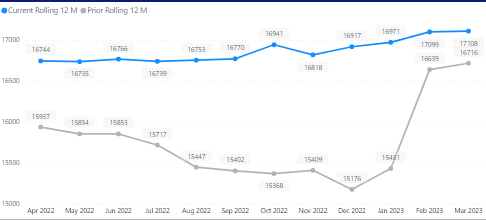
hello @Anonymous , unfortunately that is not the correct output graph I want. this is what the end results should look like, which I solved recently:
Now I just need to be able to sort by Month and Year in this format April 2022, etc. which I can't figure out yet. Any help is much appreciated. this is the file Google Drive, Power BI file used
- Mark as New
- Bookmark
- Subscribe
- Mute
- Subscribe to RSS Feed
- Permalink
- Report Inappropriate Content
Thank you for your reply @Anonymous , I will test and revert back to you. It seems like your results still shows big numbers, and I simply wanna show DDep values. I will share with you a simplied BI file too.
Helpful resources

Power BI Dataviz World Championships
The Power BI Data Visualization World Championships is back! Get ahead of the game and start preparing now!

| User | Count |
|---|---|
| 40 | |
| 36 | |
| 34 | |
| 31 | |
| 27 |
| User | Count |
|---|---|
| 136 | |
| 103 | |
| 67 | |
| 65 | |
| 56 |


