Join the Fabric User Panel to shape the future of Fabric.
Share feedback directly with Fabric product managers, participate in targeted research studies and influence the Fabric roadmap.
Sign up now- Power BI forums
- Get Help with Power BI
- Desktop
- Service
- Report Server
- Power Query
- Mobile Apps
- Developer
- DAX Commands and Tips
- Custom Visuals Development Discussion
- Health and Life Sciences
- Power BI Spanish forums
- Translated Spanish Desktop
- Training and Consulting
- Instructor Led Training
- Dashboard in a Day for Women, by Women
- Galleries
- Data Stories Gallery
- Themes Gallery
- Contests Gallery
- QuickViz Gallery
- Quick Measures Gallery
- Visual Calculations Gallery
- Notebook Gallery
- Translytical Task Flow Gallery
- TMDL Gallery
- R Script Showcase
- Webinars and Video Gallery
- Ideas
- Custom Visuals Ideas (read-only)
- Issues
- Issues
- Events
- Upcoming Events
Get Fabric certified for FREE! Don't miss your chance! Learn more
- Power BI forums
- Forums
- Get Help with Power BI
- Desktop
- Re: Need Help - Matrix Table Row Field Not Showing...
- Subscribe to RSS Feed
- Mark Topic as New
- Mark Topic as Read
- Float this Topic for Current User
- Bookmark
- Subscribe
- Printer Friendly Page
- Mark as New
- Bookmark
- Subscribe
- Mute
- Subscribe to RSS Feed
- Permalink
- Report Inappropriate Content
Need Help - Matrix Table Row Field Not Showing from Inactive Relation - Two Calendar Date Comparison
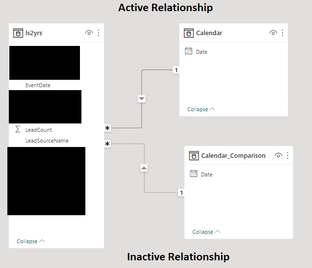
Currently I have a matrix table which is supposed to compare Lead Sources between two different calendar ranges for lead count. I have two seperate calendar tables with relationships to the main table. The 'Calendar' table has an active relationship and the secondary 'Calendar_Comparison' table has an inactive relationship with the main table ' ls2yrs'.
All the columns within my matrix table are properly displaying based on two dates. However, I'm having issues with the 'LeadSourceName' rows of the matrix table not showing all values that exist in both date ranges! In my data set the two different date ranges selected will not always have the same lead sources. For example:
'Calendar' Date Range (Active Relationship with main table): Jan 1, 2000 to Jan 5, 2000 contains lead sources:
Lead Source : Lead Count
- A lead : 1
- B lead : 2
- C lead : 1
'Calendar_Comparison' Date Range (Inactive Relationship with main table): Jan 6, 2000 to Jan 10, 2000 contains lead sources:
Lead Source : Lead Count
- A lead : 1
- B lead : 3
- C lead : 1
- D lead : 2
In this example above, the matrix table will seem to only show rows relating to lead sources which are present from the active relationship calendar table. It is missing 'D lead' which is present only on the inactive relationship 'Calendar_Comparison' date range table.
Matrix Table
Lead Source : Lead Count : Lead Count Comparison
A lead : 1 : 1
B lead : 2 : 3
C lead : 1 : 1
D lead : 0 : 2 ***(THIS ROW IS MISSING FROM MATRIX TABLE)***
How should I reconfigure my report so I can get D lead to also show up for my date comparision matrix table?
- Mark as New
- Bookmark
- Subscribe
- Mute
- Subscribe to RSS Feed
- Permalink
- Report Inappropriate Content
- Mark as New
- Bookmark
- Subscribe
- Mute
- Subscribe to RSS Feed
- Permalink
- Report Inappropriate Content
Thank you Amit! Great video series you have going on your channel! You just gained another subscriber 😁
Doing it your way works at the video time 6:26: https://youtu.be/WSeZr_-MiTg?t=386
By setting the 'Lead Count Comparison' to CALCULATE for 'Lead Count' 'with the FILTER being the maxx and minx reflective of the ALLSELECTED of the 'Calendar Comparsion' table, I was able to return all my lead sources as well as compare between two different date ranges!
Follow up question: Isolated Secondary Date Table vs Inactive Relationship Secondary Date Table
I do have an additional question: I also watched your previous video "Power BI Abstract Thesis Episode 18"
https://youtu.be/44fGGmg9fHI?t=489 . At video timing 8:09, you mentioned that your secondary date table (Date2) does not have a relationship with the main table, it is isolated.
I'm quite new to Power BI, I was wondering if I were to establish an inactive relationship for my secondary date table to main table, what impacts would that have when I'm building a comparsion matrix/table? Would this impact my comparison measures in any way (inactive realtionship vs isolated table)?
Helpful resources

Join our Community Sticker Challenge 2026
If you love stickers, then you will definitely want to check out our Community Sticker Challenge!

Power BI Monthly Update - January 2026
Check out the January 2026 Power BI update to learn about new features.

| User | Count |
|---|---|
| 63 | |
| 61 | |
| 42 | |
| 21 | |
| 18 |
| User | Count |
|---|---|
| 122 | |
| 117 | |
| 37 | |
| 34 | |
| 30 |

