FabCon is coming to Atlanta
Join us at FabCon Atlanta from March 16 - 20, 2026, for the ultimate Fabric, Power BI, AI and SQL community-led event. Save $200 with code FABCOMM.
Register now!- Power BI forums
- Get Help with Power BI
- Desktop
- Service
- Report Server
- Power Query
- Mobile Apps
- Developer
- DAX Commands and Tips
- Custom Visuals Development Discussion
- Health and Life Sciences
- Power BI Spanish forums
- Translated Spanish Desktop
- Training and Consulting
- Instructor Led Training
- Dashboard in a Day for Women, by Women
- Galleries
- Data Stories Gallery
- Themes Gallery
- Contests Gallery
- QuickViz Gallery
- Quick Measures Gallery
- Visual Calculations Gallery
- Notebook Gallery
- Translytical Task Flow Gallery
- TMDL Gallery
- R Script Showcase
- Webinars and Video Gallery
- Ideas
- Custom Visuals Ideas (read-only)
- Issues
- Issues
- Events
- Upcoming Events
The Power BI Data Visualization World Championships is back! It's time to submit your entry. Live now!
- Power BI forums
- Forums
- Get Help with Power BI
- Desktop
- Re: Multiple Pie or Better Visualization for % Mea...
- Subscribe to RSS Feed
- Mark Topic as New
- Mark Topic as Read
- Float this Topic for Current User
- Bookmark
- Subscribe
- Printer Friendly Page
- Mark as New
- Bookmark
- Subscribe
- Mute
- Subscribe to RSS Feed
- Permalink
- Report Inappropriate Content
Multiple Pie or Better Visualization for % Measure Values
Hi All,
Thank you for taking the time to take a look at my question.
I have created a sample data set that mirrors the problem I am trying to solve. The actual data set isn't based on state or regional data but has a similar breakout which I can't include due to confidentiality.
Please see the below table for context:
| ZIP | Region | State | # of Responses above 3 stars | Total # of responses |
| 1 | A | NY | 7 | 10 |
| 2 | A | NY | 8 | 11 |
| 3 | B | NY | 4 | 5 |
| 4 | B | NY | 3 | 6 |
| 5 | C | CA | 8 | 8 |
| 6 | C | CA | 7 | 10 |
I have created a measure that calculates: % of Responses > 3 Stars = sum(# of responses above 3 stars)/ sum(total # of responses) which gives me the correct % break down I am looking for. For example for Region A (7+8)/(10+11) = 71% or for Zip Code 1: 7/10 = 70%.
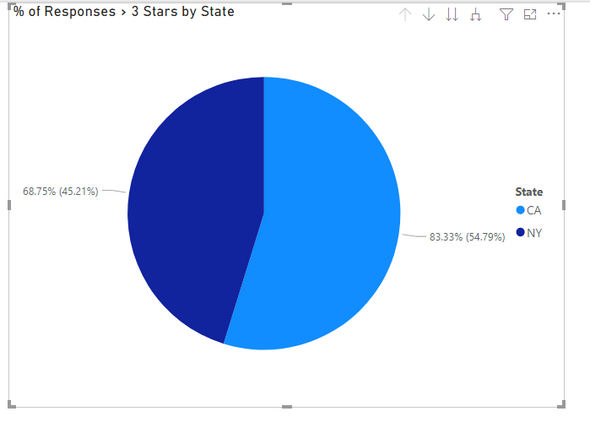
When using a pie chart I put this measure as the values field and the State, Region, and ZIP (in that order) in the legend field of a pie or doughnut chart. It shows me the below:
I would like to see two seperate pie charts and then have the abilitly for them to split into more pie charts as I drill down to the next levels of the report. Is this possible? And if it is, is there a better visualization that I should be using instead? The real data set has 5000+ unique keys at its lowest level so a pie chart obviously wouldn't be the best solution. Any help is much appreciated. I am new to power bi so sorry if this is a poor question!
Solved! Go to Solution.
- Mark as New
- Bookmark
- Subscribe
- Mute
- Subscribe to RSS Feed
- Permalink
- Report Inappropriate Content
Hi @RykH ,
Have you tried a bar chart with hierarchy? That would give you a better visualization and you could drill down and get the details has you need, since it will appear more bars on your visualization instead of a single bar.
Regards
Miguel Félix
Did I answer your question? Mark my post as a solution!
Proud to be a Super User!
Check out my blog: Power BI em Português- Mark as New
- Bookmark
- Subscribe
- Mute
- Subscribe to RSS Feed
- Permalink
- Report Inappropriate Content
Thank you for the response! We did discuss the bar chart but were hoping we could drill down using pie charts. My work around is that I created a sheet with the guages I wanted to see and enabled drill through. That way we can drill down to which ever level we desire on a bar chart then drill through on a particular area to see how we are performing in all the relevant metrics. Thank you and if you know of another work around please let me know!
Helpful resources

Power BI Dataviz World Championships
The Power BI Data Visualization World Championships is back! It's time to submit your entry.

Power BI Monthly Update - January 2026
Check out the January 2026 Power BI update to learn about new features.

| User | Count |
|---|---|
| 60 | |
| 46 | |
| 30 | |
| 24 | |
| 23 |
| User | Count |
|---|---|
| 144 | |
| 106 | |
| 64 | |
| 38 | |
| 31 |

