Get certified for free when you join Fabric Data Days 2026 and dive into Fabric, Power BI, SQL, AI, and other essential data skills.
Join nowJuly 7 - July 17 | Round 2 of the Power BI Dataviz World Championships. Don't miss your chance! Learn more
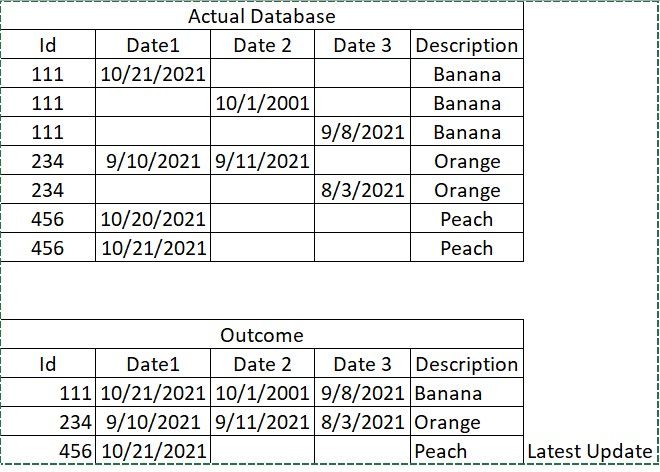
I have a database where the main ID is the core (repeated) value, and each additional column has its own data.
I want to merge rows and columns in a way that each row has all the columns filled, and I can have a single view of each core ID.
What is the best way to do that?
Solved! Go to Solution.
Hi, @mglomb ;
You could group by in power query .
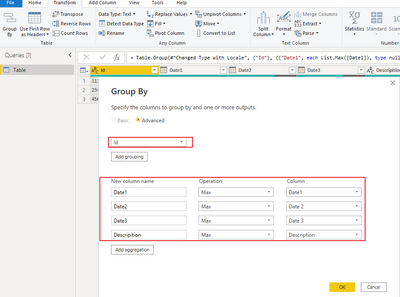
The final output is shown below:

let
Source = Table.FromRows(Json.Document(Binary.Decompress(Binary.FromText("i45WMjQ0VNJRMjTQNzLUNzIwAnEgyCkxL1EhL1EpVgemCKIOpMzAEKEGXQkQWepbwMxCUmFkbAKWA9kFkQSykS31L0rMS09FUgtBFvrGMEVIKkxMzaDuNkB1d0BqYnIGmhJDrEpiAQ==", BinaryEncoding.Base64), Compression.Deflate)), let _t = ((type nullable text) meta [Serialized.Text = true]) in type table [Id = _t, Date1 = _t, #"Date 2" = _t, #"Date 3" = _t, Description = _t]),
#"Changed Type with Locale" = Table.TransformColumnTypes(Source, {{"Date1", type date}, {"Date 2", type date}, {"Date 3", type date}}, "en-US"),
#"Grouped Rows" = Table.Group(#"Changed Type with Locale", {"Id"}, {{"Date1", each List.Max([Date1]), type nullable date}, {"Date2", each List.Max([Date 2]), type nullable date}, {"Date3", each List.Max([Date 3]), type nullable date}, {"Descripition", each List.Max([Description]), type nullable text}})
in
#"Grouped Rows"
Best Regards,
Community Support Team_ Yalan Wu
If this post helps, then please consider Accept it as the solution to help the other members find it more quickly.
Hi, @mglomb ;
You could group by in power query .
The final output is shown below:
let
Source = Table.FromRows(Json.Document(Binary.Decompress(Binary.FromText("i45WMjQ0VNJRMjTQNzLUNzIwAnEgyCkxL1EhL1EpVgemCKIOpMzAEKEGXQkQWepbwMxCUmFkbAKWA9kFkQSykS31L0rMS09FUgtBFvrGMEVIKkxMzaDuNkB1d0BqYnIGmhJDrEpiAQ==", BinaryEncoding.Base64), Compression.Deflate)), let _t = ((type nullable text) meta [Serialized.Text = true]) in type table [Id = _t, Date1 = _t, #"Date 2" = _t, #"Date 3" = _t, Description = _t]),
#"Changed Type with Locale" = Table.TransformColumnTypes(Source, {{"Date1", type date}, {"Date 2", type date}, {"Date 3", type date}}, "en-US"),
#"Grouped Rows" = Table.Group(#"Changed Type with Locale", {"Id"}, {{"Date1", each List.Max([Date1]), type nullable date}, {"Date2", each List.Max([Date 2]), type nullable date}, {"Date3", each List.Max([Date 3]), type nullable date}, {"Descripition", each List.Max([Description]), type nullable text}})
in
#"Grouped Rows"
Best Regards,
Community Support Team_ Yalan Wu
If this post helps, then please consider Accept it as the solution to help the other members find it more quickly.
@mglomb ,The information you have provided is not making the problem clear to me. Can you please explain with an example.
Can you share sample data and sample output in table format? Or a sample pbix after removing sensitive data.
Appreciate your Kudos.
You can check for fill up and filldown and pivot and unpivot options in power query
Thank you for trying to help. I've drawn a simple example of what the database look and what I'm trying to achieve. Please see below:
Join us in Barcelona for FabCon and SQLCon, the Fabric, Power BI, SQL, and AI community event. Save €200 with code FABCMTY200.
Join Data Days 2026: 60 days of free live/on-demand sessions, challenges, study groups, and certification opportunities.
| User | Count |
|---|---|
| 26 | |
| 23 | |
| 19 | |
| 18 | |
| 15 |
| User | Count |
|---|---|
| 47 | |
| 44 | |
| 43 | |
| 35 | |
| 31 |