Huge last-minute discounts for FabCon Vienna from September 15-18, 2025
Supplies are limited. Contact info@espc.tech right away to save your spot before the conference sells out.
Get your discount- Power BI forums
- Get Help with Power BI
- Desktop
- Service
- Report Server
- Power Query
- Mobile Apps
- Developer
- DAX Commands and Tips
- Custom Visuals Development Discussion
- Health and Life Sciences
- Power BI Spanish forums
- Translated Spanish Desktop
- Training and Consulting
- Instructor Led Training
- Dashboard in a Day for Women, by Women
- Galleries
- Data Stories Gallery
- Themes Gallery
- Contests Gallery
- Quick Measures Gallery
- Notebook Gallery
- Translytical Task Flow Gallery
- TMDL Gallery
- R Script Showcase
- Webinars and Video Gallery
- Ideas
- Custom Visuals Ideas (read-only)
- Issues
- Issues
- Events
- Upcoming Events
Score big with last-minute savings on the final tickets to FabCon Vienna. Secure your discount
- Power BI forums
- Forums
- Get Help with Power BI
- Desktop
- Measure based on different columns
- Subscribe to RSS Feed
- Mark Topic as New
- Mark Topic as Read
- Float this Topic for Current User
- Bookmark
- Subscribe
- Printer Friendly Page
- Mark as New
- Bookmark
- Subscribe
- Mute
- Subscribe to RSS Feed
- Permalink
- Report Inappropriate Content
Measure based on different columns
Hi everyone,
I want to create a percent measure in DAX that is based on 13 columns. The values in these 13 columns are "yes" or "no" answers.
So if the person has 7 yes out of the 13, then it needs to return 53,8% and if 10 out of 13 then 76,9%.
Hope someone can help 🙂
Solved! Go to Solution.
- Mark as New
- Bookmark
- Subscribe
- Mute
- Subscribe to RSS Feed
- Permalink
- Report Inappropriate Content
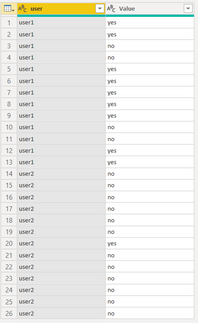
I'll suggest to first unpivot these columns, so that you get something like this:
(Select n all the columns containing the "yes" & "no" values > right click > click "Unpivot Columns")
Then you can add a new colum to change the "yes" & "no" values to 1 and 0 , to make it easier to do calculations.
Numbers = if(Table[Value] = "yes" , 1, 0)
Now you add a measure that uses this column to calculate the average:
AVG = AVERAGE(Table[Numbers])
Use this measure in a visual to display the % :


