This is best Fabric, Power BI, SQL and AI community event. How do we know? The last event sold out! Save €200 with code FABCMTY200.
Register nowA new Data Days event is coming soon! This time we’re going bigger than ever. Fabric, Power BI, SQL, AI and more. Don't miss out.
Hello everyone.
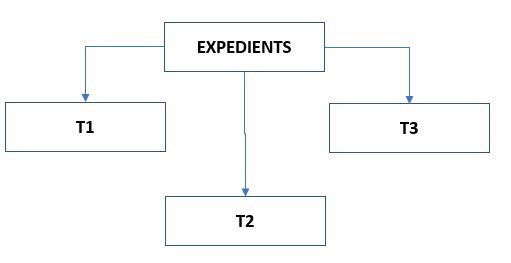
I have the following data model:
And the following measure:
Invoiced =
VAR
LinT1= CALCULATE(SUM(T1[Import]); T1[Type]=1)
VAR
LinT2 = CALCULATE(SUM(T2[Import]))
VAR
LinT3 = CALCULATE(SUM(T3[Import]); T3[Type]=1)
RETURN
IF(Expedients[Master] = X ; LinT1 + LinT2; LinT1 + LinT3)
In a matrix visualization, I show the Collaborator, CodExpedient and the previous measurement:
| COLLABORATOR | All | |
| COLLABORATOR | CODEXPEDIENT | Invoiced |
| C1 | A | |
| C1 | B | |
| C1 | C | |
| C1 | D | |
| C1 | E | |
| C2 | F | |
| C2 | G | |
| C2 | B | |
| C2 | D |
Where COLLABORATOR: All is a filter for the collaborator code.
What should be the expression X of the condition of the if function to perform a calculation or another depending on whether the value of the Master field of the Expedient table for each expedient is equal to the value of the Collaborator field of each expedient?
For exemple:
| COLLABORATOR | CODEXPEDIENT | MASTER | INVOICED |
| C1 | A | C1 | LinT1 + LinT2 |
| C1 | B | C1 | LinT1 + LinT2 |
| C1 | C | C1 | LinT1 + LinT2 |
| C1 | D | C3 | LinT1 + LinT3 |
| C1 | E | C1 | LinT1 + LinT2 |
| C2 | F | C4 | LinT1 + LinT3 |
| C2 | G | C2 | LinT1 + LinT2 |
| C2 | B | C1 | LinT1 + LinT3 |
| C2 | D | C3 | LinT1 + LinT3 |
Thank you for your help.
Hi @Raul,
Can you share your dummy pbix file please? Or the original data. I have no idea about "C3, C4". Which table do these columns belong to? Maybe you can try it like this:
Min(Expedients[Master]) = min(expendients[MASTER])
Best Regards,
Dale
Hi @v-jiascu-msft,
The result of this formula is not correct. Always return false.
Any other suggestion?
Ok, I have a new situation. I have managed to show in a new column (ISMASTER) into the table a 1 value if a condition is true and a 0 value if it is not. Now I need to know how to evaluate the value of each record in one measure to obtain one result or another.
This is the matrix visualization:
| CODEXPEDIENT | TOTAL | Max ISMASTER |
| E1 | $ 113,75 | 0 |
| E3 | $ 1.010,00 | 0 |
| E23 | $ 39,50 | 0 |
| E24 | $ 55,25 | 1 |
| E30 | $ - | 1 |
| E32 | $ 16,25 | 0 |
I want a new measure to obtain this result:
Measure = IF(T1.[ISMASTER] = 1; SUM(T1.[Import]); SUM(T2.[Import]))
What should be the condition of the IF function? Thank you.
Hi @v-jiascu-msft,
I can't share de pbix original file because the data model of the previous message is a portion of the all data model. But I can especificate you the structure of each table:
| EXPEDIENTS |
| CODEXPEDIENT |
| DATEEXP |
| MASTER |
| T1 |
| CODT1 |
| COLLABORATOR |
| TYPE |
| IMPORT |
| T2 |
| CODT2 |
| COLLABORATOR |
| TYPE |
| IMPORT |
| T3 |
| CODT3 |
| COLLABORATOR |
| TYPE |
| IMPORT |
Thanks for your post.
Check out the May 2026 Power BI update to learn about new features.
Sign up to receive a private message when registration opens and key events begin.
If you have recently started exploring Fabric, we'd love to hear how it's going. Your feedback can help with product improvements.
| User | Count |
|---|---|
| 26 | |
| 25 | |
| 24 | |
| 21 | |
| 14 |
| User | Count |
|---|---|
| 56 | |
| 50 | |
| 26 | |
| 19 | |
| 18 |