FabCon is coming to Atlanta
Join us at FabCon Atlanta from March 16 - 20, 2026, for the ultimate Fabric, Power BI, AI and SQL community-led event. Save $200 with code FABCOMM.
Register now!- Power BI forums
- Get Help with Power BI
- Desktop
- Service
- Report Server
- Power Query
- Mobile Apps
- Developer
- DAX Commands and Tips
- Custom Visuals Development Discussion
- Health and Life Sciences
- Power BI Spanish forums
- Translated Spanish Desktop
- Training and Consulting
- Instructor Led Training
- Dashboard in a Day for Women, by Women
- Galleries
- Data Stories Gallery
- Themes Gallery
- Contests Gallery
- QuickViz Gallery
- Quick Measures Gallery
- Visual Calculations Gallery
- Notebook Gallery
- Translytical Task Flow Gallery
- TMDL Gallery
- R Script Showcase
- Webinars and Video Gallery
- Ideas
- Custom Visuals Ideas (read-only)
- Issues
- Issues
- Events
- Upcoming Events
Get Fabric Certified for FREE during Fabric Data Days. Don't miss your chance! Request now
- Power BI forums
- Forums
- Get Help with Power BI
- Desktop
- Re: Measure Count and include blanks
- Subscribe to RSS Feed
- Mark Topic as New
- Mark Topic as Read
- Float this Topic for Current User
- Bookmark
- Subscribe
- Printer Friendly Page
- Mark as New
- Bookmark
- Subscribe
- Mute
- Subscribe to RSS Feed
- Permalink
- Report Inappropriate Content
Measure Count and include blanks
Hi,
I would like to create a simple measure from table 1, Column 2 where the result should be a count of Green, Blue and Blanks. When working with visuals it does not include the blank cells.
Table 1
Column 1 Column 2
Case 1 Green
Case 2 Blue
Case 3
Case 4 Green
Case 5 Blue
Case 6
Case 7 Green
Case 8 Blue
Result:
Green = 3
Blue = 3
Blank = 2
Any idea how I could display the blanks in the visual part? (Either by counting blanks or adding zeros)
Br
Stian
Solved! Go to Solution.
- Mark as New
- Bookmark
- Subscribe
- Mute
- Subscribe to RSS Feed
- Permalink
- Report Inappropriate Content
Ok understand it....
-Goto Edit Queries From Home Tab
-Select Column which has NULL Values
-Click on Replace Values
-Replace 'null' values with nothing
-Click 'OK'
-Close & Apply
Now you will see blank values in Donut Chart
- Mark as New
- Bookmark
- Subscribe
- Mute
- Subscribe to RSS Feed
- Permalink
- Report Inappropriate Content
what DAX can we equate this to? - for those who want to know?
- Mark as New
- Bookmark
- Subscribe
- Mute
- Subscribe to RSS Feed
- Permalink
- Report Inappropriate Content
- Mark as New
- Bookmark
- Subscribe
- Mute
- Subscribe to RSS Feed
- Permalink
- Report Inappropriate Content
What Visual you are working on ???
You can see blank Values with counts unless you have Page /Report/Visual Level filter applied on it for blank values
- Mark as New
- Bookmark
- Subscribe
- Mute
- Subscribe to RSS Feed
- Permalink
- Report Inappropriate Content
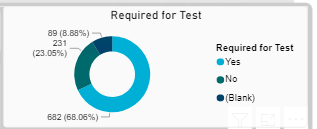
Hi,
This is how it looks for me:
- Mark as New
- Bookmark
- Subscribe
- Mute
- Subscribe to RSS Feed
- Permalink
- Report Inappropriate Content
Ok understand it....
-Goto Edit Queries From Home Tab
-Select Column which has NULL Values
-Click on Replace Values
-Replace 'null' values with nothing
-Click 'OK'
-Close & Apply
Now you will see blank values in Donut Chart
- Mark as New
- Bookmark
- Subscribe
- Mute
- Subscribe to RSS Feed
- Permalink
- Report Inappropriate Content
Hi and thanks for the assistance.
This worked fine when I use excel as data source, but my real data uses direct queries from an sql database / view. That's probably why I need to figure out how to create a meaure that prints 0 instead of "null"
- Mark as New
- Bookmark
- Subscribe
- Mute
- Subscribe to RSS Feed
- Permalink
- Report Inappropriate Content
Then you should use ISNULL/COALESCE in SQL queries to handle Null Values.
- Mark as New
- Bookmark
- Subscribe
- Mute
- Subscribe to RSS Feed
- Permalink
- Report Inappropriate Content
Forgot picture
Helpful resources

Power BI Monthly Update - November 2025
Check out the November 2025 Power BI update to learn about new features.

Fabric Data Days
Advance your Data & AI career with 50 days of live learning, contests, hands-on challenges, study groups & certifications and more!

| User | Count |
|---|---|
| 104 | |
| 82 | |
| 68 | |
| 50 | |
| 46 |


