Fabric Data Days starts November 4th!
Advance your Data & AI career with 50 days of live learning, dataviz contests, hands-on challenges, study groups & certifications and more!
Get registered- Power BI forums
- Get Help with Power BI
- Desktop
- Service
- Report Server
- Power Query
- Mobile Apps
- Developer
- DAX Commands and Tips
- Custom Visuals Development Discussion
- Health and Life Sciences
- Power BI Spanish forums
- Translated Spanish Desktop
- Training and Consulting
- Instructor Led Training
- Dashboard in a Day for Women, by Women
- Galleries
- Data Stories Gallery
- Themes Gallery
- Contests Gallery
- QuickViz Gallery
- Quick Measures Gallery
- Visual Calculations Gallery
- Notebook Gallery
- Translytical Task Flow Gallery
- TMDL Gallery
- R Script Showcase
- Webinars and Video Gallery
- Ideas
- Custom Visuals Ideas (read-only)
- Issues
- Issues
- Events
- Upcoming Events
Get Fabric Certified for FREE during Fabric Data Days. Don't miss your chance! Request now
- Power BI forums
- Forums
- Get Help with Power BI
- Desktop
- Re: Measure: Calculate % of results that equal cr...
- Subscribe to RSS Feed
- Mark Topic as New
- Mark Topic as Read
- Float this Topic for Current User
- Bookmark
- Subscribe
- Printer Friendly Page

- Mark as New
- Bookmark
- Subscribe
- Mute
- Subscribe to RSS Feed
- Permalink
- Report Inappropriate Content
Measure: Calculate % of results that equal criteria within another table
Hi,
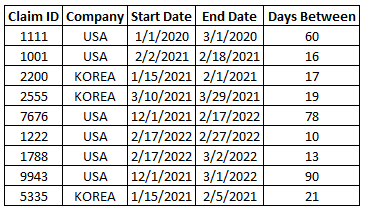
I need help creating a custom measure that will return the % of [Claim ID] that have a [Days Between] value equal to or less than the reference values in another table. This percentage would need to calculate the percentage based on only that [Company] number of distinct [Claim ID]. I need the measure to by dynamic so that it calculates based on a Slicer's selection for that [Company]
Here is an example data set with the Claim Data:
Here is an example data set with the reference values:
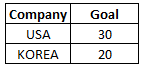
Given this example data, I would expect the measure to return a value of 50% when USA is selected from the slicer and 67% when Korea is selected.
- USA should = 50% since 3 out of 6 distinct [Claim ID] had a [Days Between] value equal to or less than 30
- Korea should = 67% since 2 out of 3 distinct [Claim ID] had a [Days Between] value equal to or less than 20
Can you please assist me in creating this type of measure?
Thank you,
Andrew
Solved! Go to Solution.


- Mark as New
- Bookmark
- Subscribe
- Mute
- Subscribe to RSS Feed
- Permalink
- Report Inappropriate Content
Hi @Anonymous
Try this...
% Claims Better Than Goal =
VAR ClaimSummary =
    ADDCOLUMNS(
        Claims,
        "DaysBetween",
        DATEDIFF(
            Claims[StartDate],
            Claims[EndDate],
            DAY
        ),
        "Goal",
        RELATED(Companies[Goal])
    )
VAR ClaimCount = COUNTROWS(ClaimSummary)
VAR ClaimsBeatingGoalCount =
    COUNTROWS(
        FILTER(
            ClaimSummary,
            [DaysBetween] <= [Goal]
        )
    )
RETURN

DIVIDE(
    ClaimsBeatingGoalCount,
    ClaimCount,
    BLANK()
)
Hope this helps!


- Mark as New
- Bookmark
- Subscribe
- Mute
- Subscribe to RSS Feed
- Permalink
- Report Inappropriate Content
Hi, @Anonymous
Create a calculated col in datatable
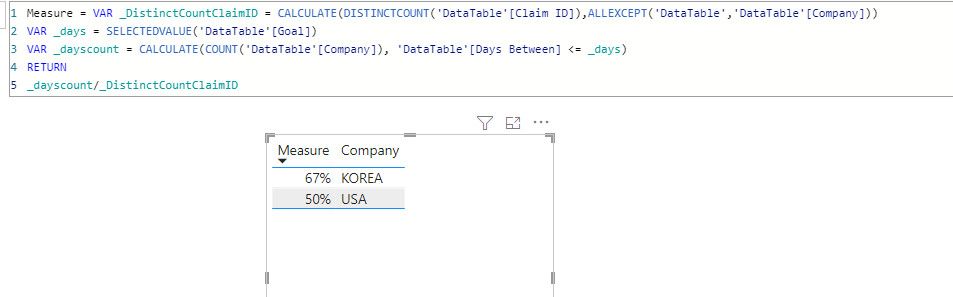
If solve your requirement, please mark this answer as SOLUTION
If this comment helps you, please LIKE this comment/Kudos
Proud to be a Super User! |  |
- Mark as New
- Bookmark
- Subscribe
- Mute
- Subscribe to RSS Feed
- Permalink
- Report Inappropriate Content
@Anonymous if you change the data type from a duration to whole number you should be ok. Worked with the pbix I attached.
- Mark as New
- Bookmark
- Subscribe
- Mute
- Subscribe to RSS Feed
- Permalink
- Report Inappropriate Content
Hi, @Anonymous
Create a calculated col in datatable
If solve your requirement, please mark this answer as SOLUTION
If this comment helps you, please LIKE this comment/Kudos
Proud to be a Super User! | |
- Mark as New
- Bookmark
- Subscribe
- Mute
- Subscribe to RSS Feed
- Permalink
- Report Inappropriate Content
Hi @Anonymous
Try this...
% Claims Better Than Goal =
VAR ClaimSummary =
    ADDCOLUMNS(
        Claims,
        "DaysBetween",
        DATEDIFF(
            Claims[StartDate],
            Claims[EndDate],
            DAY
        ),
        "Goal",
        RELATED(Companies[Goal])
    )
VAR ClaimCount = COUNTROWS(ClaimSummary)
VAR ClaimsBeatingGoalCount =
    COUNTROWS(
        FILTER(
            ClaimSummary,
            [DaysBetween] <= [Goal]
        )
    )
RETURN

DIVIDE(
    ClaimsBeatingGoalCount,
    ClaimCount,
    BLANK()
)
Hope this helps!
- Mark as New
- Bookmark
- Subscribe
- Mute
- Subscribe to RSS Feed
- Permalink
- Report Inappropriate Content
I tried this but the
RELATED(Companies[Goal]) portion of the DAX gave me trouble. My reference table has a numerical value set while the DATEDIFF is returning a interval of days. So, the DAX isn't finding a similar data type.
How can I resolve this issue?
- Mark as New
- Bookmark
- Subscribe
- Mute
- Subscribe to RSS Feed
- Permalink
- Report Inappropriate Content
@Anonymous DATEDIFF returns the count of interval boundaries crossed between two dates: a numeric result. It clearly works...
Could you share your pbix to try to figure this out?
- Mark as New
- Bookmark
- Subscribe
- Mute
- Subscribe to RSS Feed
- Permalink
- Report Inappropriate Content
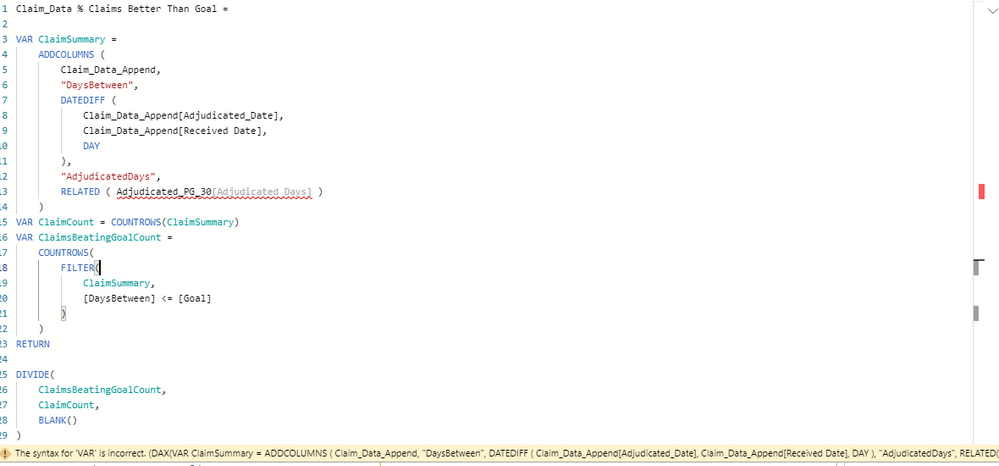
I verified in Power Query that [Adjudicated Days] is set as a numerical value, table name = '
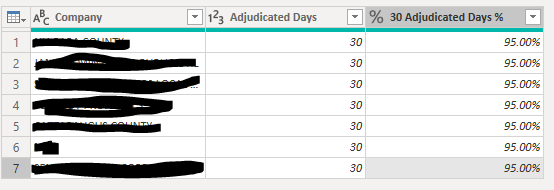
Here is a screen grab of the DAX. The RELATED ( Adjudicated_PG_30[Adjudicated Days] ) returns an error of "Parameter is not correct type" and it then cannot find the column name "Adjudicated Days"
- Mark as New
- Bookmark
- Subscribe
- Mute
- Subscribe to RSS Feed
- Permalink
- Report Inappropriate Content
@Anonymous you're trying to solve this in Power Query??? 😯
- Mark as New
- Bookmark
- Subscribe
- Mute
- Subscribe to RSS Feed
- Permalink
- Report Inappropriate Content
Oh no. I was just showing you that I confirmed in Power Query that
- Mark as New
- Bookmark
- Subscribe
- Mute
- Subscribe to RSS Feed
- Permalink
- Report Inappropriate Content
@Anonymous if you change the data type from a duration to whole number you should be ok. Worked with the pbix I attached.
Helpful resources

Power BI Monthly Update - November 2025
Check out the November 2025 Power BI update to learn about new features.

Fabric Data Days
Advance your Data & AI career with 50 days of live learning, contests, hands-on challenges, study groups & certifications and more!

FabCon Atlanta 2026
Join us at FabCon Atlanta, March 16-20, for the ultimate Fabric, Power BI, AI and SQL community-led event. Save $200 with code FABCOMM.


| User | Count |
|---|---|
| 97 | |
| 73 | |
| 50 | |
| 46 | |
| 44 |


