Get certified for free when you join Fabric Data Days 2026 and dive into Fabric, Power BI, SQL, AI, and other essential data skills.
Join nowJuly 28 - August 9 | Final Round of the Power BI Dataviz World Championships. This is your chance. Learn more
Hi group ,
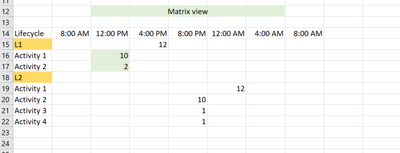
I have a matrix table wherein rows have values in multiple column. See example below - L1 is rolled down to activity level. In power Bi when I role it up using matrix it shows me the value for activities as well.How can I hide the rolled up values for activities.
Any other tables that I could use for this purpose?
Desired outcome would be -
Thanks
Solved! Go to Solution.
Hi @iamdata ,
With your description, I'm not quite sure how your current matrix visual was built from the data in the picture, what I created doesn't seem to be quite the same as yours, is there a difference between the data you used and the data provided?
Besides, you might consider using table visual:
Best Regards,
Jianbo Li
If this post helps, then please consider Accept it as the solution to help the other members find it more quickly.
Hi @iamdata ,
With your description, I'm not quite sure how your current matrix visual was built from the data in the picture, what I created doesn't seem to be quite the same as yours, is there a difference between the data you used and the data provided?
Besides, you might consider using table visual:
Best Regards,
Jianbo Li
If this post helps, then please consider Accept it as the solution to help the other members find it more quickly.
Join us in Barcelona for FabCon and SQLCon, the Fabric, Power BI, SQL, and AI community event. Save €200 with code FABCMTY200.
If you love stickers, then you will definitely want to check out our community sticker challenge, Barcelona edition!
Check out the July 2026 Power BI update to learn about new features.
| User | Count |
|---|---|
| 31 | |
| 28 | |
| 24 | |
| 24 | |
| 19 |
| User | Count |
|---|---|
| 44 | |
| 32 | |
| 18 | |
| 17 | |
| 16 |