Get certified for free when you join Fabric Data Days 2026 and dive into Fabric, Power BI, SQL, AI, and other essential data skills.
Join nowJuly 28 - August 9 | Final Round of the Power BI Dataviz World Championships. This is your chance. Learn more
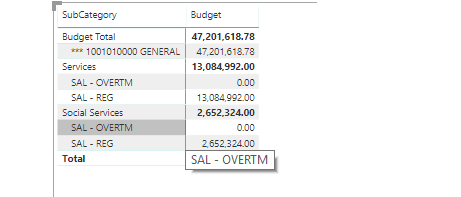
I have a matrix that is made up of two categories for the sake of this post. Those two Categories feed into my totals. How do you format data so that I can have a total first row as my drop down in my matrix? Basically, I want the viz to open with just the Total rows and the Services/Social Services inside of it. Not Pictured is what I am going for. The following Pictures would serve as dropdown click 1 and dropdown clikc 2
IMAGE 1 : SHOULD BE A PIC OF JUST THE BUDGET TOTAL ROW
Image 2: One Drop Down Click
Image 3: Two Dropdowns
Solved! Go to Solution.
Hi @bw70316,
If you add both your subcategories in the Rows of the matrix is possible to create a hierarchy that drill down within thew matrix.
https://docs.microsoft.com/en-us/power-bi/visuals/desktop-matrix-visual
Check the Drill down on row headers part for implementing this.
Regards,
MFelix
Regards
Miguel Félix
Proud to be a Super User!
Check out my blog: Power BI em PortuguêsHi @bw70316,
If you add both your subcategories in the Rows of the matrix is possible to create a hierarchy that drill down within thew matrix.
https://docs.microsoft.com/en-us/power-bi/visuals/desktop-matrix-visual
Check the Drill down on row headers part for implementing this.
Regards,
MFelix
Regards
Miguel Félix
Proud to be a Super User!
Check out my blog: Power BI em PortuguêsJoin us in Barcelona for FabCon and SQLCon, the Fabric, Power BI, SQL, and AI community event. Save €200 with code FABCMTY200.
If you love stickers, then you will definitely want to check out our community sticker challenge, Barcelona edition!
Check out the July 2026 Power BI update to learn about new features.
| User | Count |
|---|---|
| 30 | |
| 28 | |
| 24 | |
| 23 | |
| 16 |
| User | Count |
|---|---|
| 46 | |
| 32 | |
| 17 | |
| 17 | |
| 16 |