FabCon is coming to Atlanta
Join us at FabCon Atlanta from March 16 - 20, 2026, for the ultimate Fabric, Power BI, AI and SQL community-led event. Save $200 with code FABCOMM.
Register now!- Power BI forums
- Get Help with Power BI
- Desktop
- Service
- Report Server
- Power Query
- Mobile Apps
- Developer
- DAX Commands and Tips
- Custom Visuals Development Discussion
- Health and Life Sciences
- Power BI Spanish forums
- Translated Spanish Desktop
- Training and Consulting
- Instructor Led Training
- Dashboard in a Day for Women, by Women
- Galleries
- Data Stories Gallery
- Themes Gallery
- Contests Gallery
- QuickViz Gallery
- Quick Measures Gallery
- Visual Calculations Gallery
- Notebook Gallery
- Translytical Task Flow Gallery
- TMDL Gallery
- R Script Showcase
- Webinars and Video Gallery
- Ideas
- Custom Visuals Ideas (read-only)
- Issues
- Issues
- Events
- Upcoming Events
The Power BI Data Visualization World Championships is back! Get ahead of the game and start preparing now! Learn more
- Power BI forums
- Forums
- Get Help with Power BI
- Desktop
- Lookin for bar chart that allows for subcategories
- Subscribe to RSS Feed
- Mark Topic as New
- Mark Topic as Read
- Float this Topic for Current User
- Bookmark
- Subscribe
- Printer Friendly Page
- Mark as New
- Bookmark
- Subscribe
- Mute
- Subscribe to RSS Feed
- Permalink
- Report Inappropriate Content
Lookin for bar chart that allows for subcategories
Hello everybody!
My goal is to visually represent every floor of a building and also show how much space each tenant occupies on each floor.
The two main requirements are the following:
1) Sort the bar columns from lowest floor to highest floor so that the order is identical to real life
2) Each bar shows how much of each floor is occupied by a specific tenant. Name of tenant/floor is immediately visible.
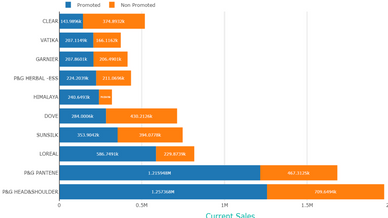
Using the inbuilt Power BI stacked bar chart, I can make something like this:
The good thing is that this chart is sorted correctly: EG, 1. OG, 2.OG, 3.OG... (i.e., it correctly responds to the "Sort by column" command). Sadly, it can only show values (m²) within the bars instead of the name of the tenants.
An alternative I discovered from the store is this "Treemap Bar Chart by MAQ Software".
This chart meets my second requirement since it allows me to show the name of the tenants (this feature here is called "SubLegend"). Sadly the chart cannot be sorted, though.
Does anyone know of a visual element that can satisfy both requirements?
Best regards!
Solved! Go to Solution.
- Mark as New
- Bookmark
- Subscribe
- Mute
- Subscribe to RSS Feed
- Permalink
- Report Inappropriate Content
Thanks for the reply. I solved the problem by using the "Treemap Bar Chart by MAQ Software" chart and simply adding an alphabetical prefix to the name of the floor (e.g., "(a) EG"). This chart only ever sorts by alphabet.
- Mark as New
- Bookmark
- Subscribe
- Mute
- Subscribe to RSS Feed
- Permalink
- Report Inappropriate Content
Hi @MH_Ger,
Here is Stacked Bar with Custom Label and Sorting which will help you to get tenant name as data label and sort the visual.


Download link for the custom visual file in this page,
https://pbivizedit.com/gallery/stacked-bar-chart-with-custom-data-label-and-sorting
This was made with our Custom Visual creator tool PBIVizEdit.com. With this tool,
- anyone, irrespective of technical skills, can create their own visuals
- 15 minutes to create a visual from scratch
- opens up many additional attributes to edit (for e.g. labels, tooltips, legends position, etc)
Give this a shot and let us know if you face any problem/errors.
You can use the editor to modify your visual further (some modifications cannot be done in Power BI window and have to be in editor).
Thanks,
Team PBIVizEdit
- Mark as New
- Bookmark
- Subscribe
- Mute
- Subscribe to RSS Feed
- Permalink
- Report Inappropriate Content
Hi @MH_Ger
I didn't find a visual that can satisfy both requirements. As a workaround, you could use the built-in stacked bar chart and turn on Legend option in it. This can show you the names of the tenants.
You could raise up an idea at Ideas (powerbi.com) to let other people vote for it. Here is one similar idea you can vote up: Microsoft Idea - Stacked Bar Chart Choose Data Label
Best Regards,
Community Support Team _ Jing
If this post helps, please Accept it as Solution to help other members find it.
- Mark as New
- Bookmark
- Subscribe
- Mute
- Subscribe to RSS Feed
- Permalink
- Report Inappropriate Content
Thanks for the reply. I solved the problem by using the "Treemap Bar Chart by MAQ Software" chart and simply adding an alphabetical prefix to the name of the floor (e.g., "(a) EG"). This chart only ever sorts by alphabet.
Helpful resources

Power BI Dataviz World Championships
The Power BI Data Visualization World Championships is back! Get ahead of the game and start preparing now!

| User | Count |
|---|---|
| 39 | |
| 38 | |
| 38 | |
| 28 | |
| 27 |
| User | Count |
|---|---|
| 124 | |
| 88 | |
| 73 | |
| 66 | |
| 65 |


