
Get certified for free when you join Fabric Data Days 2026 and dive into Fabric, Power BI, SQL, AI, and other essential data skills.
Join nowJuly 7 - July 17 | Round 2 of the Power BI Dataviz World Championships. Don't miss your chance! Learn more
Good morning,
I would like to have some tips on this scenario:
I need to load a calendar table based on a time range interval which is coresponding to the Max And Min Date of another table.
How you would manage it?
Thanks
Solved! Go to Solution.
@thebigwhite , Based on what I got
You can try like
Date =calendar(Min(Table[Date]),Max(Table[Date]))
or date =calendarauto()
You can use addcolumns on top of it add other calendar columns
https://radacad.com/creating-calendar-table-in-power-bi-using-dax-functions
Appreciate your Kudos.
Are you trying to build a calendar table from scratch based on the date range in your 'fact' table?
There are a lot of ways to do this: Here's one way:
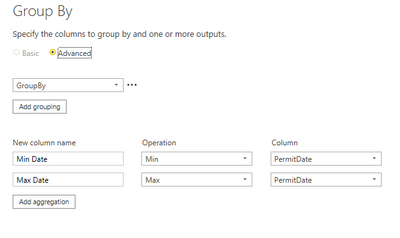
1. Extract the MAX and MIN dates from a dulicate of your FACT Table:
Use the Group By function and extract Max and Min from the date column
Then add two custom columns that identify the start of the month and end of the month for your date range.
EndDate = Date.EndOfMonth([Max Date])
StartDate = Date.StartofMonth([Min Date])
Then use this formula to make a list of all the days between your start date and end date
{Number.From([StartDate])..Number.From([EndDate])}
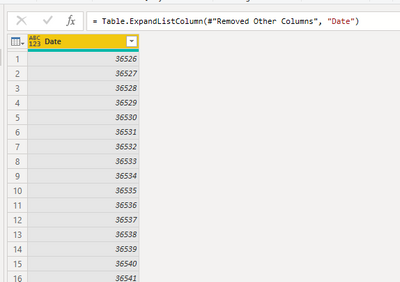
Remove all the other columns - and expand the list
Change this to Date Format - and you are good to go!
Add whatever extra columns you want to make this a true date table:
@thebigwhite , Based on what I got
You can try like
Date =calendar(Min(Table[Date]),Max(Table[Date]))
or date =calendarauto()
You can use addcolumns on top of it add other calendar columns
https://radacad.com/creating-calendar-table-in-power-bi-using-dax-functions
Appreciate your Kudos.
Join us in Barcelona for FabCon and SQLCon, the Fabric, Power BI, SQL, and AI community event. Save €200 with code FABCMTY200.
If you love stickers, then you will definitely want to check out our community sticker challenge, Barcelona edition!
Check out the July 2026 Power BI update to learn about new features.
| User | Count |
|---|---|
| 30 | |
| 26 | |
| 23 | |
| 23 | |
| 14 |
| User | Count |
|---|---|
| 46 | |
| 33 | |
| 20 | |
| 18 | |
| 16 |