

Get certified for free when you join Fabric Data Days 2026 and dive into Fabric, Power BI, SQL, AI, and other essential data skills.
Join nowJuly 7 - July 17 | Round 2 of the Power BI Dataviz World Championships. Don't miss your chance! Learn more
Hi there,
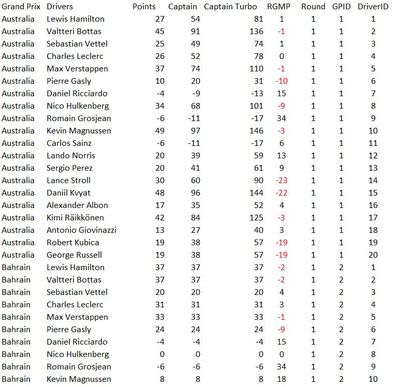
I have been attempting to solve this issue for awhile but have hit a snag. I'd like some assistance to create a report to populate the points for fields Drive 1, Driver 2, Driver 3, RGMP, Captain and Turbo in Table 1 for the corresponding Grand Prix in Table 2.
For example, the report would have a chart showing:
Table 1
Table 2
I understand in Power BI only one field can be joined between two tables. In this case, how to join multiple fields between two tables?
Thanks,
Philip
Hello @kcdask
In PowerQuery, you could unpivot these columns before loading it into table 1
Then in both Table 1 and Table 2 create a column that combintes [Grand Prix] and [Driver] then join the two tables on that field
I'd like to create a relationship between the two tables so that points in Table 2 would populate for the corresponding driver in Table 1 for the specific Grand Prix.
Also, I would like to create a hierarchy in Table 1 in the order of Player>Drivers 1, 2, 3 for points scored. Creating a relationship between the two tables is best to achieve this outcome?
Yes, creating the relationship is the way to go. Do you have an .pbix file you with the data that you can share?
Join us in Barcelona for FabCon and SQLCon, the Fabric, Power BI, SQL, and AI community event. Save €200 with code FABCMTY200.
Check out the July 2026 Power BI update to learn about new features.
Join Data Days 2026: 60 days of free live/on-demand sessions, challenges, study groups, and certification opportunities.
| User | Count |
|---|---|
| 31 | |
| 30 | |
| 27 | |
| 24 | |
| 16 |
| User | Count |
|---|---|
| 54 | |
| 37 | |
| 27 | |
| 24 | |
| 20 |