Hi @AndyTrezise,
Please check out the demo in the attachment.
Since there aren't any continuous dates, I think a date table is needed. For example, it will be hard to get the next month of December 2018 without a date table.
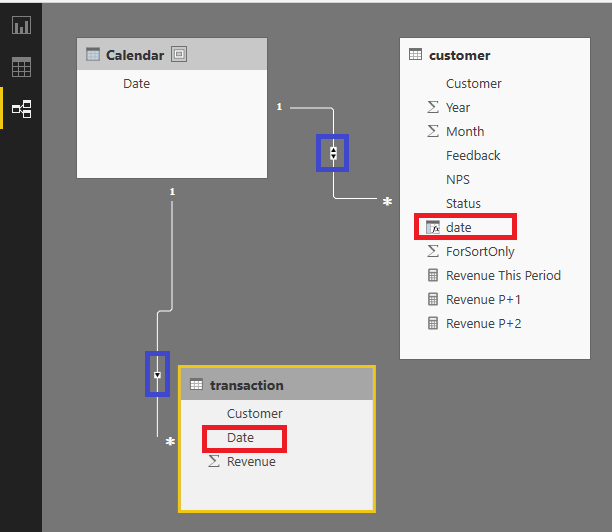
1. Create a date table.
Calendar = CALENDARAUTO()
2. Create a new column of table Customer.
date = date([Year], [Month],1)
3. Establish relationships and change the "Filter direction".
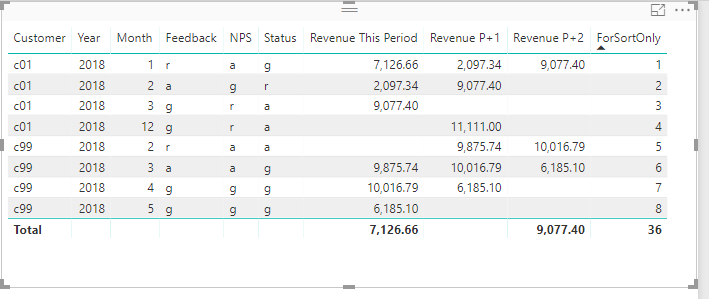
4. Create several measures.
Revenue This Period =
CALCULATE (
    SUM ( 'transaction'[Revenue] ),
    FILTER (
        ALL ( 'transaction' ),
        'transaction'[Customer] = MIN ( 'customer'[Customer] )
            && YEAR ( 'transaction'[Date] ) = MIN ( 'customer'[Year] )
            && MONTH ( 'transaction'[Date] ) = MIN ( 'customer'[Month] )
    ),
    ALL ( 'customer' )
)
Revenue P+1 =
CALCULATE (
    SUM ( 'transaction'[Revenue] ),
    FILTER (
        ALL ( 'transaction' ),
        'transaction'[Customer] = MIN ( 'customer'[Customer] )
    ),
    NEXTMONTH ( 'Calendar'[Date] ),
    ALL ( customer )
)
Revenue P+2 =
CALCULATE (
    SUM ( 'transaction'[Revenue] ),
    FILTER (
        ALL ( 'transaction' ),
        'transaction'[Customer] = MIN ( 'customer'[Customer] )
    ),
    DATESINPERIOD (
        'Calendar'[Date],
        EOMONTH ( MIN ( 'Calendar'[Date] ), 2 ),
        -1,
        MONTH
    ),
    ALL ( customer )
)
Best Regards,
Dale
Community Support Team _ Dale
If this post helps, then please consider Accept it as the solution to help the other members find it more quickly.


