cancel
Showing results for 
Search instead for 
Did you mean: 

Level up your Power BI skills this month - build one visual each week and tell better stories with data! Get started

Reply
Jbmolina93
Frequent Visitor

Join two tables with different number of rows and columns to one bar graph

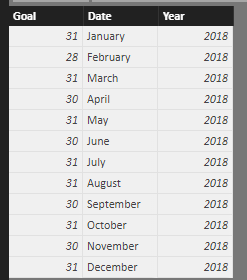
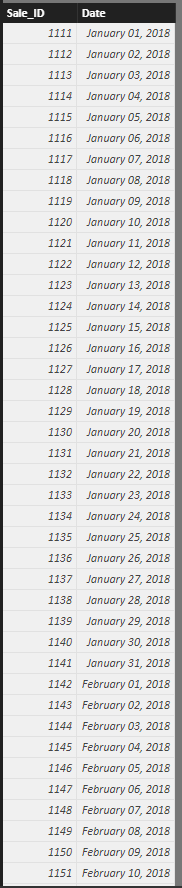
I have two tables. One is "Sales" the other is sales "Goal". So sales have the "sale ID" which I want to count to show a monthly count of sales bar chart with a line showing the goal for that month. I also need to drill down to the month and show the sales per day in the month along with the line representing the goal divided by the days of that month. My problem is the data does not have the same columns. How would I fix this? Please and thank you.

GoalGoal


SalesSales


2 REPLIES 2
Anonymous
Not applicable

Hi @Jbmolina93,


We need to first create common columns in the 2 tables to join them.


For Table 1 Create a Month_Year column:


Month_Year = 'Goal'[Date] & ", " & 'Goal'[Year]


For table 2:


Month_Year = FORMAT('Sales'[Date], "MMM, YYYY")


Then join these columns and you should be good to go.

I get an error when I try and join.

"The column with the name of 'Date' already exists in the 'Table' Table."

error.PNG

Helpful resources

Announcements
April Power BI Update Carousel

Power BI Monthly Update - April 2026

Check out the April 2026 Power BI update to learn about new features.

Fabric SQL PBI Data Days

Data Days 2026 coming soon!

Sign up to receive a private message when registration opens and key events begin.

New to Fabric survey Carousel

New to Fabric Survey

If you have recently started exploring Fabric, we'd love to hear how it's going. Your feedback can help with product improvements.

Power BI DataViz World Championships carousel

Power BI DataViz World Championships - June 2026

A new Power BI DataViz World Championship is coming this June! Don't miss out on submitting your entry.