FabCon is coming to Atlanta
Join us at FabCon Atlanta from March 16 - 20, 2026, for the ultimate Fabric, Power BI, AI and SQL community-led event. Save $200 with code FABCOMM.
Register now!- Power BI forums
- Get Help with Power BI
- Desktop
- Service
- Report Server
- Power Query
- Mobile Apps
- Developer
- DAX Commands and Tips
- Custom Visuals Development Discussion
- Health and Life Sciences
- Power BI Spanish forums
- Translated Spanish Desktop
- Training and Consulting
- Instructor Led Training
- Dashboard in a Day for Women, by Women
- Galleries
- Data Stories Gallery
- Themes Gallery
- Contests Gallery
- QuickViz Gallery
- Quick Measures Gallery
- Visual Calculations Gallery
- Notebook Gallery
- Translytical Task Flow Gallery
- TMDL Gallery
- R Script Showcase
- Webinars and Video Gallery
- Ideas
- Custom Visuals Ideas (read-only)
- Issues
- Issues
- Events
- Upcoming Events
The Power BI Data Visualization World Championships is back! It's time to submit your entry. Live now!
- Power BI forums
- Forums
- Get Help with Power BI
- Desktop
- Inventory Calculation
- Subscribe to RSS Feed
- Mark Topic as New
- Mark Topic as Read
- Float this Topic for Current User
- Bookmark
- Subscribe
- Printer Friendly Page
- Mark as New
- Bookmark
- Subscribe
- Mute
- Subscribe to RSS Feed
- Permalink
- Report Inappropriate Content
Inventory Calculation
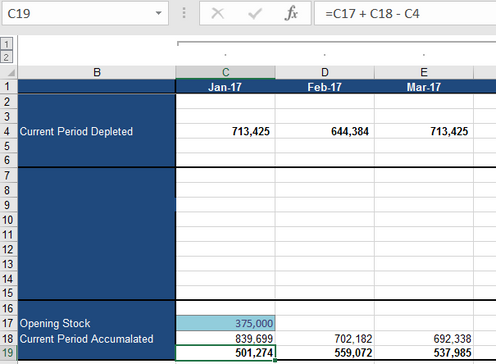
I need to make a fairly simple calculation involving time intelligence measures but Im struggling with it. Bascially in Excel the calculation is as follows:
Monthly Inventory(C19) = Opening stock (C17) + Current period accumulated (C18) - Current period depleted (C4)
= 375000 +839699 - 713425
= 501,274
The data starts from January 2017 and hence C17 is fixed for that month.
For the next period onwards the calculation is (for example D19)
D19 = D18 + Inventory at end of last month(C19) - D4
= 702182 +501274 - 644384
= 559072
I have a date table with all dates ranging from 01/01/2017 to 31/12/2025 and the Years, months, quarters to go with it. And a Facts table which is connected to the Date table with the Date column. I just want the monthly change in inventory, so was wondering what is the best way to go about it ?
Abhi
Solved! Go to Solution.
- Mark as New
- Bookmark
- Subscribe
- Mute
- Subscribe to RSS Feed
- Permalink
- Report Inappropriate Content
I managed to solve it. This is how I did it. I defined a measure which gave me the first month of the data
00_MinMonthIndex = Min('Date'[MonthIndex])
Using this I calculcalated a measure for opening inventory
01_Opening Pit Inventory At Start = If([00_MinMonthIndex] =1,375000,0)
I then calculated monthly inventory change as
02_ Inventory change = [00_Opening Pit Inventory At Start] + FactTable(Current period accumulated) - FactTable(Current period depleted)
Finally got the cumulative inventory
03_Total Inventory = CALCULATE (
[02_Inventory change],
FILTER (
ALL ( 'Date'[Date]),
'Date'[Date] <= MAX ( ( 'Date'[Date] ) )))
It took me a while to arrive at the solution because I was focussed on time intelligence formulas but in the end it was just a basic cumulative calculation which did the trick.
Abhi
- Mark as New
- Bookmark
- Subscribe
- Mute
- Subscribe to RSS Feed
- Permalink
- Report Inappropriate Content
Hi @Capstone,
Could you post the structure of your facts table with some sample data? So that we can help with the measure.![]()
Regards
- Mark as New
- Bookmark
- Subscribe
- Mute
- Subscribe to RSS Feed
- Permalink
- Report Inappropriate Content
I managed to solve it. This is how I did it. I defined a measure which gave me the first month of the data
00_MinMonthIndex = Min('Date'[MonthIndex])
Using this I calculcalated a measure for opening inventory
01_Opening Pit Inventory At Start = If([00_MinMonthIndex] =1,375000,0)
I then calculated monthly inventory change as
02_ Inventory change = [00_Opening Pit Inventory At Start] + FactTable(Current period accumulated) - FactTable(Current period depleted)
Finally got the cumulative inventory
03_Total Inventory = CALCULATE (
[02_Inventory change],
FILTER (
ALL ( 'Date'[Date]),
'Date'[Date] <= MAX ( ( 'Date'[Date] ) )))
It took me a while to arrive at the solution because I was focussed on time intelligence formulas but in the end it was just a basic cumulative calculation which did the trick.
Abhi
- Mark as New
- Bookmark
- Subscribe
- Mute
- Subscribe to RSS Feed
- Permalink
- Report Inappropriate Content
Hi @Capstone,
Great to hear the problem got resolved! Could you accept your reply as solution to help others who may have similar issue easily find the answer and close this thread?![]()
Regards
Helpful resources

Power BI Dataviz World Championships
The Power BI Data Visualization World Championships is back! It's time to submit your entry.

Power BI Monthly Update - January 2026
Check out the January 2026 Power BI update to learn about new features.

| User | Count |
|---|---|
| 71 | |
| 45 | |
| 34 | |
| 28 | |
| 23 |
| User | Count |
|---|---|
| 143 | |
| 123 | |
| 59 | |
| 40 | |
| 33 |

