This is best Fabric, Power BI, SQL and AI community event. How do we know? The last event sold out! Save €200 with code FABCMTY200.
Register nowA new Data Days event is coming soon! This time we’re going bigger than ever. Fabric, Power BI, SQL, AI and more. Don't miss out.
Hello,
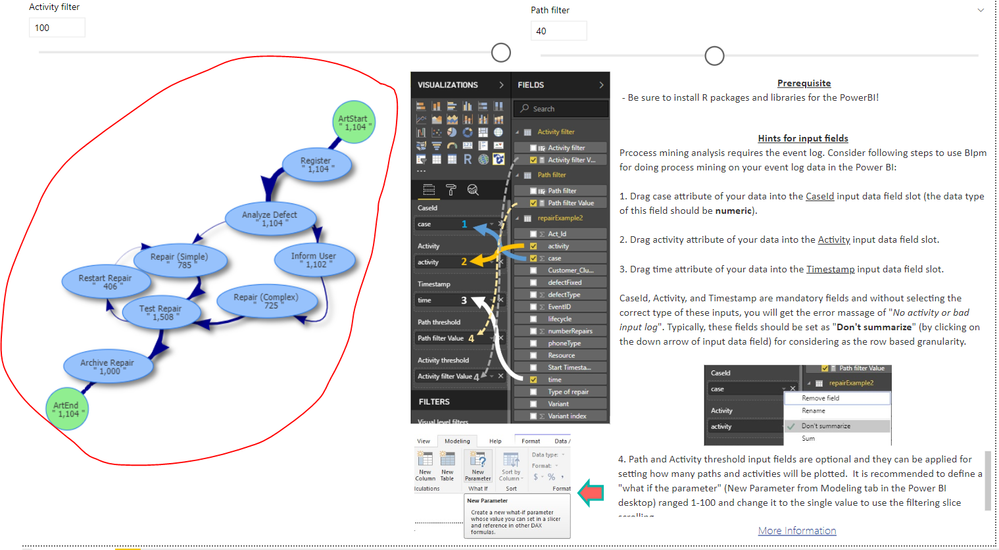
I recently installed the Interative Directed Flow Graph, and I'm having trouble getting the visual to display in power bi desktop. I have the sample file from the marketplace, and am just trying to get the sample to display. In my first installation, I fixed all of the R related errors(installed the missing packages), but now I recieve No Activity or Bad Input Log error. Any help would be greatly appreciated.
Thank You
Solved! Go to Solution.
Hello,
I don't know what happened but I just received a prompt to install some R packaged that never happened before followed by an update to Power bi. I had never seen this process before, no matter how many items I restarted. So yes, the script does work properly. Thank you for looking into this issue.
Hi @rtaylor ,
By my tests with the latest version of Power BI Desktop and the example pbix file from AppStore, everything works as expected.
Please check if you have installed the latest version of Power BI Desktop 2.69.5467.2151 firstly.
Best Regards,
Cherry
Hello,
I don't know what happened but I just received a prompt to install some R packaged that never happened before followed by an update to Power bi. I had never seen this process before, no matter how many items I restarted. So yes, the script does work properly. Thank you for looking into this issue.
Check out the May 2026 Power BI update to learn about new features.
Sign up to receive a private message when registration opens and key events begin.
If you have recently started exploring Fabric, we'd love to hear how it's going. Your feedback can help with product improvements.
| User | Count |
|---|---|
| 32 | |
| 26 | |
| 25 | |
| 24 | |
| 15 |
| User | Count |
|---|---|
| 63 | |
| 48 | |
| 27 | |
| 23 | |
| 20 |