FabCon is coming to Atlanta
Join us at FabCon Atlanta from March 16 - 20, 2026, for the ultimate Fabric, Power BI, AI and SQL community-led event. Save $200 with code FABCOMM.
Register now!- Power BI forums
- Get Help with Power BI
- Desktop
- Service
- Report Server
- Power Query
- Mobile Apps
- Developer
- DAX Commands and Tips
- Custom Visuals Development Discussion
- Health and Life Sciences
- Power BI Spanish forums
- Translated Spanish Desktop
- Training and Consulting
- Instructor Led Training
- Dashboard in a Day for Women, by Women
- Galleries
- Data Stories Gallery
- Themes Gallery
- Contests Gallery
- QuickViz Gallery
- Quick Measures Gallery
- Visual Calculations Gallery
- Notebook Gallery
- Translytical Task Flow Gallery
- TMDL Gallery
- R Script Showcase
- Webinars and Video Gallery
- Ideas
- Custom Visuals Ideas (read-only)
- Issues
- Issues
- Events
- Upcoming Events
The Power BI Data Visualization World Championships is back! Get ahead of the game and start preparing now! Learn more
- Power BI forums
- Forums
- Get Help with Power BI
- Desktop
- Re: Incremental line graph
- Subscribe to RSS Feed
- Mark Topic as New
- Mark Topic as Read
- Float this Topic for Current User
- Bookmark
- Subscribe
- Printer Friendly Page
- Mark as New
- Bookmark
- Subscribe
- Mute
- Subscribe to RSS Feed
- Permalink
- Report Inappropriate Content
Incremental line graph
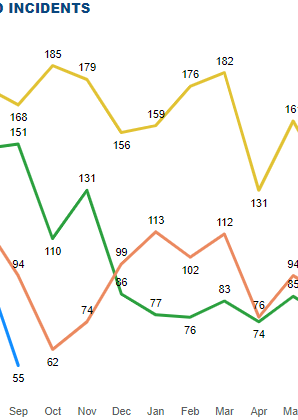
Please could you help guiding me on this?
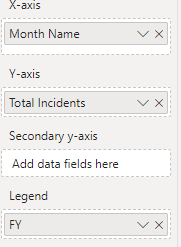
At the moment I have:
Total Incidents is DISTINCTCOUNT of report ID
Month Name and FY are from the calendar table
How do I make this line graph to appear incrementally for each year?
Aug = Aug count
Sep = Aug + Sep counts
Oct = Aug + Sep + Oct counts
...
Please please, thank you very much
- Mark as New
- Bookmark
- Subscribe
- Mute
- Subscribe to RSS Feed
- Permalink
- Report Inappropriate Content
Tried TOTALYTD but I don't quite understand, however I came up with the below but I would like to have the Measure reset in Aug each year
Please thank you
- Mark as New
- Bookmark
- Subscribe
- Mute
- Subscribe to RSS Feed
- Permalink
- Report Inappropriate Content
Oh, if you want it to reset within a specific partition, check out the WINDOW function. https://learn.microsoft.com/en-us/dax/window-function-dax
Example 2 should be quite useful:
RunningSum = SUMX ( WINDOW ( 1, ABS, 0, REL, ALLSELECTED ( 'Date'[Fiscal Year], 'Date'[Month Number Of Year] ), PARTITIONBY ( 'Date'[Fiscal Year] ) ), [Total Sales] )
- Mark as New
- Bookmark
- Subscribe
- Mute
- Subscribe to RSS Feed
- Permalink
- Report Inappropriate Content
Thank you for your help and suggestion, I ended up using:
- Mark as New
- Bookmark
- Subscribe
- Mute
- Subscribe to RSS Feed
- Permalink
- Report Inappropriate Content
Thank you very much for your patience, my DAX knowledge is <0.
I will keep researching.
Thanks again
- Mark as New
- Bookmark
- Subscribe
- Mute
- Subscribe to RSS Feed
- Permalink
- Report Inappropriate Content
I think you're looking for a cumulative sum. Try using the TOTALYTD function
- Mark as New
- Bookmark
- Subscribe
- Mute
- Subscribe to RSS Feed
- Permalink
- Report Inappropriate Content
thank you, I will look at this function
Helpful resources

Power BI Dataviz World Championships
The Power BI Data Visualization World Championships is back! Get ahead of the game and start preparing now!

| User | Count |
|---|---|
| 39 | |
| 38 | |
| 38 | |
| 28 | |
| 27 |
| User | Count |
|---|---|
| 124 | |
| 88 | |
| 73 | |
| 66 | |
| 65 |


