FabCon is coming to Atlanta
Join us at FabCon Atlanta from March 16 - 20, 2026, for the ultimate Fabric, Power BI, AI and SQL community-led event. Save $200 with code FABCOMM.
Register now!- Power BI forums
- Get Help with Power BI
- Desktop
- Service
- Report Server
- Power Query
- Mobile Apps
- Developer
- DAX Commands and Tips
- Custom Visuals Development Discussion
- Health and Life Sciences
- Power BI Spanish forums
- Translated Spanish Desktop
- Training and Consulting
- Instructor Led Training
- Dashboard in a Day for Women, by Women
- Galleries
- Data Stories Gallery
- Themes Gallery
- Contests Gallery
- QuickViz Gallery
- Quick Measures Gallery
- Visual Calculations Gallery
- Notebook Gallery
- Translytical Task Flow Gallery
- TMDL Gallery
- R Script Showcase
- Webinars and Video Gallery
- Ideas
- Custom Visuals Ideas (read-only)
- Issues
- Issues
- Events
- Upcoming Events
Vote for your favorite vizzies from the Power BI Dataviz World Championship submissions. Vote now!
- Power BI forums
- Forums
- Get Help with Power BI
- Desktop
- Re: Inconsistent filter context behavior in matrix...
- Subscribe to RSS Feed
- Mark Topic as New
- Mark Topic as Read
- Float this Topic for Current User
- Bookmark
- Subscribe
- Printer Friendly Page
- Mark as New
- Bookmark
- Subscribe
- Mute
- Subscribe to RSS Feed
- Permalink
- Report Inappropriate Content
Inconsistent filter context behavior in matrix visualization
In a matrix visualization, a cell which is the intersection of table columns A and B does not manifest filter context consistently as you change how A and B are configured in the matrix on Rows and Columns.
This appears to be a defect or at best a very confusing feature. It makes the matrix visualization considerably less functional and more likely to show erroneous/unexpected results.
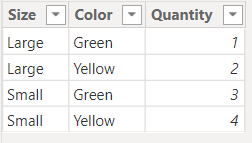
Here is a very simple example. The inconsistent behavior is not specific to the example shown here. It can be reproduced with any comparable dataset.
1. Create a table.

2. Create a matrix visualization.
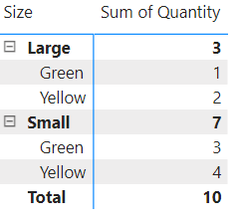
- Size and Color on Rows.
- Sum of Quantity on Values.
- Expand all down one level in the hierarchy
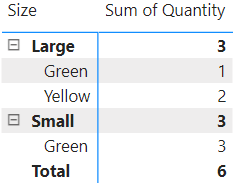
3. Filter on Sum of Quantity is less than 4.
4. Move Color to Columns. Notice that we do not have the same Values as in step #3.
Solved! Go to Solution.
- Mark as New
- Bookmark
- Subscribe
- Mute
- Subscribe to RSS Feed
- Permalink
- Report Inappropriate Content
@doug_morris I think you are using a visual level filter and it is very well explained here. It is all about understanding how DAX works.
Subscribe to the @PowerBIHowTo YT channel for an upcoming video on List and Record functions in Power Query!!
Learn Power BI and Fabric - subscribe to our YT channel - Click here: @PowerBIHowTo
If my solution proved useful, I'd be delighted to receive Kudos. When you put effort into asking a question, it's equally thoughtful to acknowledge and give Kudos to the individual who helped you solve the problem. It's a small gesture that shows appreciation and encouragement! ❤
Did I answer your question? Mark my post as a solution. Proud to be a Super User! Appreciate your Kudos 🙂
Feel free to email me with any of your BI needs.
- Mark as New
- Bookmark
- Subscribe
- Mute
- Subscribe to RSS Feed
- Permalink
- Report Inappropriate Content
@doug_morris it's ok. Sometime we miss things. And I have seen similar question many times and that's why I was quick to share the posts. Anyhow, glad you know what is going on. We all need to be slow down and read things bit more carefully. I also miss things, and many times.
Best!
Subscribe to the @PowerBIHowTo YT channel for an upcoming video on List and Record functions in Power Query!!
Learn Power BI and Fabric - subscribe to our YT channel - Click here: @PowerBIHowTo
If my solution proved useful, I'd be delighted to receive Kudos. When you put effort into asking a question, it's equally thoughtful to acknowledge and give Kudos to the individual who helped you solve the problem. It's a small gesture that shows appreciation and encouragement! ❤
Did I answer your question? Mark my post as a solution. Proud to be a Super User! Appreciate your Kudos 🙂
Feel free to email me with any of your BI needs.
- Mark as New
- Bookmark
- Subscribe
- Mute
- Subscribe to RSS Feed
- Permalink
- Report Inappropriate Content
@doug_morris appreciate the feedback. If you don't want to read the article and understand why it is happening, not sure what else can be done. I don't want to explain something which is already well explained.
Good luck!
Subscribe to the @PowerBIHowTo YT channel for an upcoming video on List and Record functions in Power Query!!
Learn Power BI and Fabric - subscribe to our YT channel - Click here: @PowerBIHowTo
If my solution proved useful, I'd be delighted to receive Kudos. When you put effort into asking a question, it's equally thoughtful to acknowledge and give Kudos to the individual who helped you solve the problem. It's a small gesture that shows appreciation and encouragement! ❤
Did I answer your question? Mark my post as a solution. Proud to be a Super User! Appreciate your Kudos 🙂
Feel free to email me with any of your BI needs.
- Mark as New
- Bookmark
- Subscribe
- Mute
- Subscribe to RSS Feed
- Permalink
- Report Inappropriate Content
My comment about it being spam was regarding your other post which gave no solution but only an advertisement for your YT channel. Maybe that post was an mistake. I didn't see your second response or overlooked it because it appeared so much like the other post. I see the linked article in your second response and thank you for it. That addresses my question directly. I will add a reply to that post, give it a thumbs up, and accept it as a solution.
- Mark as New
- Bookmark
- Subscribe
- Mute
- Subscribe to RSS Feed
- Permalink
- Report Inappropriate Content
Subscribe to the @PowerBIHowTo YT channel for an upcoming video on List and Record functions in Power Query!!
Learn Power BI and Fabric - subscribe to our YT channel - Click here: @PowerBIHowTo
If my solution proved useful, I'd be delighted to receive Kudos. When you put effort into asking a question, it's equally thoughtful to acknowledge and give Kudos to the individual who helped you solve the problem. It's a small gesture that shows appreciation and encouragement! ❤
Did I answer your question? Mark my post as a solution. Proud to be a Super User! Appreciate your Kudos 🙂
Feel free to email me with any of your BI needs.
- Mark as New
- Bookmark
- Subscribe
- Mute
- Subscribe to RSS Feed
- Permalink
- Report Inappropriate Content
To be frank, your response is spam. If I could give a thumbs down, I would.
- Mark as New
- Bookmark
- Subscribe
- Mute
- Subscribe to RSS Feed
- Permalink
- Report Inappropriate Content
@doug_morris I think you are using a visual level filter and it is very well explained here. It is all about understanding how DAX works.
Subscribe to the @PowerBIHowTo YT channel for an upcoming video on List and Record functions in Power Query!!
Learn Power BI and Fabric - subscribe to our YT channel - Click here: @PowerBIHowTo
If my solution proved useful, I'd be delighted to receive Kudos. When you put effort into asking a question, it's equally thoughtful to acknowledge and give Kudos to the individual who helped you solve the problem. It's a small gesture that shows appreciation and encouragement! ❤
Did I answer your question? Mark my post as a solution. Proud to be a Super User! Appreciate your Kudos 🙂
Feel free to email me with any of your BI needs.
- Mark as New
- Bookmark
- Subscribe
- Mute
- Subscribe to RSS Feed
- Permalink
- Report Inappropriate Content
Thank you, this article addresses the issue. As it says in the article, "For a matrix visual, the filter granularity is defined by attributes applied to the Rows section of the matrix, ignoring the attributes applied to the Columns section." I think it's extremely non-intuitive for the matrix visualization to ignore Columns from the filter granularity. Simply changing row/column format without any change to the aggregation in a viz, I would not expect the effect of a filter to change. I guess the workarounds are to move the filter to a page-level filter (which won't work for measures) or to move the filtering into a DAX expression. Both seem to be muddled workarounds, but I guess that's what we have to live with given the design. Maybe there are good reasons the matrix viz was designed that way, but it's not clear to me.
Helpful resources

Power BI Dataviz World Championships
Vote for your favorite vizzies from the Power BI World Championship submissions!

Join our Community Sticker Challenge 2026
If you love stickers, then you will definitely want to check out our Community Sticker Challenge!

Power BI Monthly Update - January 2026
Check out the January 2026 Power BI update to learn about new features.

| User | Count |
|---|---|
| 55 | |
| 52 | |
| 41 | |
| 16 | |
| 16 |
| User | Count |
|---|---|
| 107 | |
| 103 | |
| 40 | |
| 33 | |
| 25 |


