Party with Power BI’s own Guy in a Cube
Power BI is turning 10! Tune in for a special live episode on July 24 with behind-the-scenes stories, product evolution highlights, and a sneak peek at what’s in store for the future.
Save the date- Power BI forums
- Get Help with Power BI
- Desktop
- Service
- Report Server
- Power Query
- Mobile Apps
- Developer
- DAX Commands and Tips
- Custom Visuals Development Discussion
- Health and Life Sciences
- Power BI Spanish forums
- Translated Spanish Desktop
- Training and Consulting
- Instructor Led Training
- Dashboard in a Day for Women, by Women
- Galleries
- Data Stories Gallery
- Themes Gallery
- Contests Gallery
- Quick Measures Gallery
- Notebook Gallery
- Translytical Task Flow Gallery
- TMDL Gallery
- R Script Showcase
- Webinars and Video Gallery
- Ideas
- Custom Visuals Ideas (read-only)
- Issues
- Issues
- Events
- Upcoming Events
Enhance your career with this limited time 50% discount on Fabric and Power BI exams. Ends August 31st. Request your voucher.
- Power BI forums
- Forums
- Get Help with Power BI
- Desktop
- Re: If date is between 2 dates from another table ...
- Subscribe to RSS Feed
- Mark Topic as New
- Mark Topic as Read
- Float this Topic for Current User
- Bookmark
- Subscribe
- Printer Friendly Page
- Mark as New
- Bookmark
- Subscribe
- Mute
- Subscribe to RSS Feed
- Permalink
- Report Inappropriate Content
If date is between 2 dates from another table return value
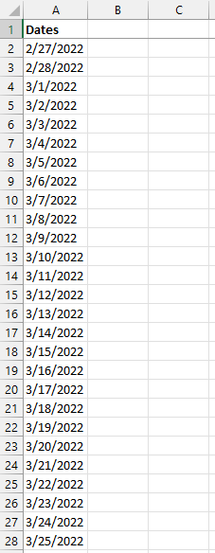
I have a DateTable with a list of dates and then I have the table below with fiscal year data:
I'm trying to add columns to the DateTable to reflect the data from this fiscal year table. For the Financial Period I was able to use the below formula and it worked great:
Financial Period w/ Dates =
MINX(
    FILTER(
        'Fiscal Calendar Data',
        'Fiscal Calendar Data'[Start Date]<=DateDim[Date] &&
        'Fiscal Calendar Data'[End Date]>=DateDim[Date]),
        'Fiscal Calendar Data'[FY Period Dates])
However when I try to use the same formula for the "Ship Days", the data returned is not correct (for P12 it returns the correct value of 20 but for all the rest of the dates it returns 19).
I've tried many other suggestions (including this one) but I continue to get the error message: A table of multiple values was supplied where a single value was expected.
Anyone have any other suggestions for how to solve this?
Solved! Go to Solution.
- Mark as New
- Bookmark
- Subscribe
- Mute
- Subscribe to RSS Feed
- Permalink
- Report Inappropriate Content
pls see the attachment to check if this is what you want
Did I answer your question? Mark my post as a solution!
Proud to be a Super User!
- Mark as New
- Bookmark
- Subscribe
- Mute
- Subscribe to RSS Feed
- Permalink
- Report Inappropriate Content
I know this thread is old but I think your formula is correct but your dataset is wrong. Periods 11 and 12 are both 13 months long. The from dates for 11 and 12 are both in 22 instead of 23.
- Mark as New
- Bookmark
- Subscribe
- Mute
- Subscribe to RSS Feed
- Permalink
- Report Inappropriate Content
@ryan_mayu Maybe you can make sense of this - I literally copied and pasted the same fiscal calendar data into your sample file (power query) as a new data source and used the same formulas you did, replacing your fiscal calendar table column with the new ones, and I'm getting different results:
- Mark as New
- Bookmark
- Subscribe
- Mute
- Subscribe to RSS Feed
- Permalink
- Report Inappropriate Content
@ryan_mayu It should be noted that the Fiscal Calendar data is coming from a shared Google Sheets doc so that it can be easily accessible for others in the company to update whne needed.
I even tried connecting your sample file to the Google Sheet I'm using for the Fiscal Calendar and I'm having the same issues in your file when I reproduce your formulas with the Google Sheet fiscal calendar. Leads me to believe this has something to do with the originating file.
Finally, I tried using an Excel file for the Fiscal Calendar data instead and I'm still getting the same incorrect results. Perplexing.
- Mark as New
- Bookmark
- Subscribe
- Mute
- Subscribe to RSS Feed
- Permalink
- Report Inappropriate Content
Thank you, @ryan_mayu! It looks good in your example. However, what's strange is when I add that formula into my pbix file it's not producing the same results. Leads me to believe there's something else going on in my file that's affecting this.
- Mark as New
- Bookmark
- Subscribe
- Mute
- Subscribe to RSS Feed
- Permalink
- Report Inappropriate Content
Hi @ryan_mayu,
I'm trying to take a date table with a list of dates:
And a fiscal calendar with various data points like the number of ship days in each period:
| Fiscal Year | Period | FY Period | FY Period Dates | Start Date | End Date | Ship Days |
| FY23 | P01 | FY23 P01 | FY23 P01 (2/28-4/3) | 2/28/2022 | 4/3/2022 | 25 |
| FY23 | P02 | FY23 P02 | FY23 P02 (4/4-5/1) | 4/4/2022 | 5/1/2022 | 20 |
| FY23 | P03 | FY23 P03 | FY23 P03 (5/2-5/29) | 5/2/2022 | 5/29/2022 | 20 |
| FY23 | P04 | FY23 P04 | FY23 P04 (5/30-7/3) | 5/30/2022 | 7/3/2022 | 24 |
| FY23 | P05 | FY23 P05 | FY23 P05 (7/4-7/31) | 7/4/2022 | 7/31/2022 | 19 |
| FY23 | P06 | FY23 P06 | FY23 P06 (8/1-8/28) | 8/1/2022 | 8/28/2022 | 20 |
| FY23 | P07 | FY23 P07 | FY23 P07 (8/29-10/2) | 8/29/2022 | 10/2/2022 | 24 |
| FY23 | P08 | FY23 P08 | FY23 P08 (10/3-10/30) | 10/3/2022 | 10/30/2022 | 20 |
| FY23 | P09 | FY23 P09 | FY23 P09 (10/31-11/27) | 10/31/2022 | 11/27/2022 | 19 |
| FY23 | P10 | FY23 P10 | FY23 P10 (11/28-1/1) | 11/28/2022 | 1/1/2023 | 24 |
| FY23 | P11 | FY23 P11 | FY23 P11 (1/2-1/29) | 1/2/2022 | 1/29/2023 | 19 |
| FY23 | P12 | FY23 P12 | FY23 P12 (1/30-2/27) | 1/30/2022 | 2/27/2023 | 20 |
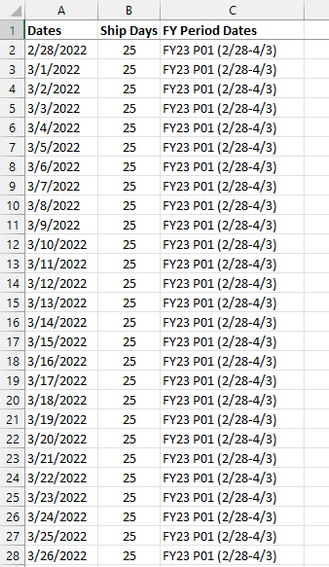
And combine them so the data from the fiscal calendar is added to the date table based on the Date (column A of the Date table) falling between the Start and End dates in the Fiscal Calendar:
- Mark as New
- Bookmark
- Subscribe
- Mute
- Subscribe to RSS Feed
- Permalink
- Report Inappropriate Content
pls see the attachment to check if this is what you want
Did I answer your question? Mark my post as a solution!
Proud to be a Super User!
- Mark as New
- Bookmark
- Subscribe
- Mute
- Subscribe to RSS Feed
- Permalink
- Report Inappropriate Content
could you pls provide the sample data for both table and the expected output?
Did I answer your question? Mark my post as a solution!
Proud to be a Super User!


