- Power BI forums
- Updates
- News & Announcements
- Get Help with Power BI
- Desktop
- Service
- Report Server
- Power Query
- Mobile Apps
- Developer
- DAX Commands and Tips
- Custom Visuals Development Discussion
- Health and Life Sciences
- Power BI Spanish forums
- Translated Spanish Desktop
- Power Platform Integration - Better Together!
- Power Platform Integrations (Read-only)
- Power Platform and Dynamics 365 Integrations (Read-only)
- Training and Consulting
- Instructor Led Training
- Dashboard in a Day for Women, by Women
- Galleries
- Community Connections & How-To Videos
- COVID-19 Data Stories Gallery
- Themes Gallery
- Data Stories Gallery
- R Script Showcase
- Webinars and Video Gallery
- Quick Measures Gallery
- 2021 MSBizAppsSummit Gallery
- 2020 MSBizAppsSummit Gallery
- 2019 MSBizAppsSummit Gallery
- Events
- Ideas
- Custom Visuals Ideas
- Issues
- Issues
- Events
- Upcoming Events
- Community Blog
- Power BI Community Blog
- Custom Visuals Community Blog
- Community Support
- Community Accounts & Registration
- Using the Community
- Community Feedback
Register now to learn Fabric in free live sessions led by the best Microsoft experts. From Apr 16 to May 9, in English and Spanish.
- Power BI forums
- Forums
- Get Help with Power BI
- Desktop
- I need help with writing a DAX measure for a kind ...
- Subscribe to RSS Feed
- Mark Topic as New
- Mark Topic as Read
- Float this Topic for Current User
- Bookmark
- Subscribe
- Printer Friendly Page
- Mark as New
- Bookmark
- Subscribe
- Mute
- Subscribe to RSS Feed
- Permalink
- Report Inappropriate Content
I need help with writing a DAX measure for a kind of "cohort" analysis
Hello,
first I'm new here, I didn't find an opportunity to attach a pbix file, how is this possible?
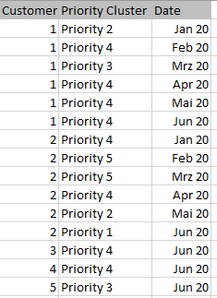
My problem is the following: I have a data table, a simplified version looks like this.
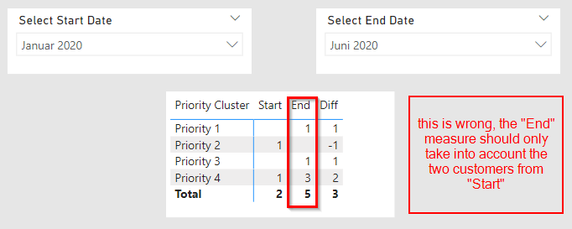
Now I would like to have two filters in Power BI, I thought about two disconnected tables. They should allow to set a "Start Date" and an "End Date". Then I want to see, how the Customers have developed between Start and End date. The tricky part is, that I only want to compare the customers, that are available in the selected Start Date. The next screenshot shows a wrong result, but basically this is how I want to display it in Power BI:
The forumla for "End" is currently:
End =
VAR EndDate = MIN('End Date'[Date])
Return CALCULATE(DISTINCTCOUNT(Data[Customer]),FILTER(Data,Data[Date]=EndDate))
Now I would like to have a formula, which takes only the 2 customers selected for the Start (this is customer nr 1 and 2), and shows what the current Priority for these two customers is at the "End" Date. The right result would be (as customer 2 was Priority 4 in Jan 2000 and moved to Priority 1 in Jun 2000):
Would be really great to get some help here, I am already despairing and trying to solve the problem for a long time
Solved! Go to Solution.
- Mark as New
- Bookmark
- Subscribe
- Mute
- Subscribe to RSS Feed
- Permalink
- Report Inappropriate Content
Hi @Landon1 ,
I suggest you to try this code to create a measure.
End =
VAR StartDate =
    MIN ( 'Start Date'[Date] )
VAR EndDate =
    MIN ( 'End Date'[Date] )
VAR LIST =
    CALCULATETABLE (
        VALUES ( Data[Customer] ),
        FILTER ( ALL ( Data ), Data[Date] = StartDate )
    )
RETURN
    CALCULATE (
        DISTINCTCOUNT ( Data[Customer] ),
        FILTER ( Data, Data[Date] = EndDate && Data[Customer] IN LIST )
    )
Result is as below.
Best Regards,
Rico Zhou
If this post helps, then please consider Accept it as the solution to help the other members find it more quickly.
Helpful resources

Microsoft Fabric Learn Together
Covering the world! 9:00-10:30 AM Sydney, 4:00-5:30 PM CET (Paris/Berlin), 7:00-8:30 PM Mexico City

Power BI Monthly Update - April 2024
Check out the April 2024 Power BI update to learn about new features.

| User | Count |
|---|---|
| 106 | |
| 104 | |
| 77 | |
| 68 | |
| 61 |
| User | Count |
|---|---|
| 148 | |
| 107 | |
| 106 | |
| 82 | |
| 70 |


