FabCon is coming to Atlanta
Join us at FabCon Atlanta from March 16 - 20, 2026, for the ultimate Fabric, Power BI, AI and SQL community-led event. Save $200 with code FABCOMM.
Register now!- Power BI forums
- Get Help with Power BI
- Desktop
- Service
- Report Server
- Power Query
- Mobile Apps
- Developer
- DAX Commands and Tips
- Custom Visuals Development Discussion
- Health and Life Sciences
- Power BI Spanish forums
- Translated Spanish Desktop
- Training and Consulting
- Instructor Led Training
- Dashboard in a Day for Women, by Women
- Galleries
- Data Stories Gallery
- Themes Gallery
- Contests Gallery
- QuickViz Gallery
- Quick Measures Gallery
- Visual Calculations Gallery
- Notebook Gallery
- Translytical Task Flow Gallery
- TMDL Gallery
- R Script Showcase
- Webinars and Video Gallery
- Ideas
- Custom Visuals Ideas (read-only)
- Issues
- Issues
- Events
- Upcoming Events
The Power BI Data Visualization World Championships is back! Get ahead of the game and start preparing now! Learn more
- Power BI forums
- Forums
- Get Help with Power BI
- Desktop
- I Need To Use a Table Visual to Filter 2 Other Vis...
- Subscribe to RSS Feed
- Mark Topic as New
- Mark Topic as Read
- Float this Topic for Current User
- Bookmark
- Subscribe
- Printer Friendly Page
- Mark as New
- Bookmark
- Subscribe
- Mute
- Subscribe to RSS Feed
- Permalink
- Report Inappropriate Content
I Need To Use a Table Visual to Filter 2 Other Visuals on Another Page in My Report
I have crime report data, and want the option for the user to read the report narrative of any case available in the data. Narrative are large blocks of text, so I want to create this visual on the page right after the main dashboard in my report.
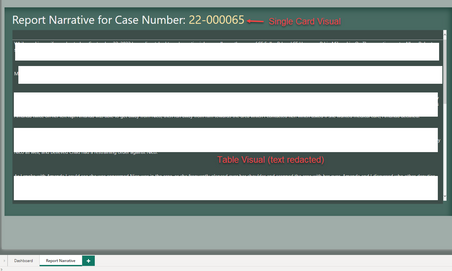
I want to have a dynamic title for the visualization that says: "Report Narrative for Case Number:" and then the case number's narrative in the visualization below it:
I want the specific case number and its accompanying narrative text to display and filter on the "Report Narrative" page based on the single case number the user selects in a display table on the dashboard page.
Is it possible to use my table visualization to filter beyond just the dashboard page and also filter both of my visualizations on my Report Narrative page? If so, could someone point me to a way to make that happen? I know it's possible to use slicers to filter an entire report with all its pages, but is it possible to use another visual like a table to do the same thing?
Thanks for anyone's time and effort to help, I appreciate it
Ashley
- Mark as New
- Bookmark
- Subscribe
- Mute
- Subscribe to RSS Feed
- Permalink
- Report Inappropriate Content
Hi @ClackamasAshley ,
I'm not quite clear about your problem, seems you want to use a visual to filter a title, if so, here's my solution.
Sample:
Create a measure.
Measure =
SELECTEDVALUE ( 'Table'[Column1] )
Create a button for the title, turn off the border of button and click "fx" besides Text.
Select the measure in the following dialog.
Get the result:
If this post helps, then please consider Accept it as the solution to help the other members find it more quickly.
Best regards,
Community Support Team_yanjiang
Helpful resources

Power BI Dataviz World Championships
The Power BI Data Visualization World Championships is back! Get ahead of the game and start preparing now!

| User | Count |
|---|---|
| 38 | |
| 38 | |
| 36 | |
| 28 | |
| 28 |
| User | Count |
|---|---|
| 124 | |
| 89 | |
| 73 | |
| 66 | |
| 65 |


