Fabric Data Days starts November 4th!
Advance your Data & AI career with 50 days of live learning, dataviz contests, hands-on challenges, study groups & certifications and more!
Get registered- Power BI forums
- Get Help with Power BI
- Desktop
- Service
- Report Server
- Power Query
- Mobile Apps
- Developer
- DAX Commands and Tips
- Custom Visuals Development Discussion
- Health and Life Sciences
- Power BI Spanish forums
- Translated Spanish Desktop
- Training and Consulting
- Instructor Led Training
- Dashboard in a Day for Women, by Women
- Galleries
- Data Stories Gallery
- Themes Gallery
- Contests Gallery
- Quick Measures Gallery
- Visual Calculations Gallery
- Notebook Gallery
- Translytical Task Flow Gallery
- TMDL Gallery
- R Script Showcase
- Webinars and Video Gallery
- Ideas
- Custom Visuals Ideas (read-only)
- Issues
- Issues
- Events
- Upcoming Events
Join us at FabCon Atlanta from March 16 - 20, 2026, for the ultimate Fabric, Power BI, AI and SQL community-led event. Save $200 with code FABCOMM. Register now.
- Power BI forums
- Forums
- Get Help with Power BI
- Desktop
- How to use a single filter on a single table with ...
- Subscribe to RSS Feed
- Mark Topic as New
- Mark Topic as Read
- Float this Topic for Current User
- Bookmark
- Subscribe
- Printer Friendly Page
- Mark as New
- Bookmark
- Subscribe
- Mute
- Subscribe to RSS Feed
- Permalink
- Report Inappropriate Content
How to use a single filter on a single table with multiple relationships
Apologies for the poor description, but I don't know how to word it.
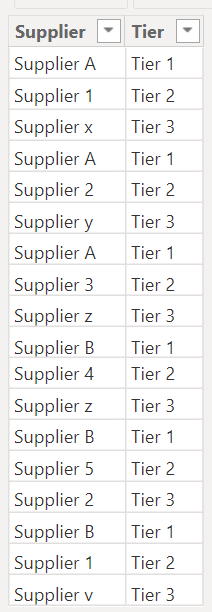
Essentially I have a supply chain mapped in an excel file (uploaded to a single tablein power BI), it looks a little something like this
| Supplier A | Supplier 1 | Supplier x |
| Supplier A | Supplier 2 | Supplier y |
| Supplier A | Supplier 3 | Supplier z |
| Supplier B | Supplier 4 | Supplier z |
| Supplier B | Supplier 5 | Supplier 2 |
| Supplier B | Supplier 1 | Supplier v |
Now, I want to create a single filter on 'Supplier Name' which when selected will only show me that suppliers 'supply chain'
EG if supplier 'x' is selected then i would expect the following return
| Supplier A | Supplier 1 | Supplier x |
| Supplier A | ||
| Supplier A |
if supplier '1' is selected i would expect the following return
| Supplier A | Supplier 1 | Supplier x |
| Supplier B | Supplier 1 | Supplier v |
I havbe tried splitting out the tier tables, and creating a master but the joins wont allow this to function as expected.
The issue is a supplier in tier 2 or 3 can appear in each section - suppliers in tier 1 will only appear in tier 1
Any help?
- Mark as New
- Bookmark
- Subscribe
- Mute
- Subscribe to RSS Feed
- Permalink
- Report Inappropriate Content
You can refer to the following solution
1.Create a slicer table
Slicer = var a=SUMMARIZE('Table',[Tier1])
var b=SUMMARIZE('Table',[Tier2])
var c=SUMMARIZE('Table',[Tier3])
return SUMMARIZE(UNION(a,b,c),[Tier1])
2.Create a calculated column in data table
Combine = [Tier1]&","&[Tier2]&","&[Tier3]3.Then create a measure, and put the measure to the visual filter
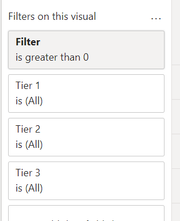
Measure = IF(ISFILTERED(Slicer[Tier1]),IF(CONTAINSSTRING(SELECTEDVALUE('Table'[Combine]),SELECTEDVALUE(Slicer[Tier1])),1,0),1)
Output
Best Regards!
Yolo Zhu
If this post helps, then please consider Accept it as the solution to help the other members find it more quickly.
- Mark as New
- Bookmark
- Subscribe
- Mute
- Subscribe to RSS Feed
- Permalink
- Report Inappropriate Content
Please check my solution in the file:
i cretated a table with all Suppliers:
i created also a column with the path of each supplier:
and then i created a measure to filter :

in the visual i used the measure to filter :
Any question just ask.
Best regards
Bruno Costa | Power Participant
Hope this answer solves your problem!
If you need any additional help please @ me in your reply.
If my reply provided you with a solution, please consider marking it as a solution or giving it a kudoe
You can also check out BI4ALL's website and our data solutions!
Best regards
Bruno Costa | Super User
Did I help you to answer your question? Accepted my post as a solution! Appreciate your Kudos!!
Take a look at the blog: PBI Portugal
Helpful resources
| User | Count |
|---|---|
| 76 | |
| 36 | |
| 31 | |
| 29 | |
| 26 |


