Get certified for free when you join Fabric Data Days 2026 and dive into Fabric, Power BI, SQL, AI, and other essential data skills.
Join nowJuly 28 - August 9 | Final Round of the Power BI Dataviz World Championships. This is your chance. Learn more
Hi! I'm starting with PowerBI and have a question about an excel I want to transform and visualize. The information comes in this way:
Requirement | Status from | Status
a | 1/1/2017 | Open
a | 1/3/2017 | In Process
a | 1/9/2017 | Closed
b | 3/2/2017 | Open
c | 2/1/2017 | Open
b | 4/1/2017 | In Process
....
What I'd like to end up are a table where I can indicate the number of days each requirement was in specific status, so in excel what I can do is sort by requirement and then by status from, and then create a new column that checks the requirement from the below's row, and if it is the same it just takes below's "status from" and deducts the one from the current row, if the below's requiremen is not the same as the current row then it uses the current date to deduct
Result should be something like:
requirement | Status | amount of days
a | open | 2
a | In Process | 6
...
I can get to that manipulating the excel before importing it in powerbi, but is there any way to do it directly in powerbi so I skip that step every time I refresh the info?
Thank you!
Solved! Go to Solution.
Hi,
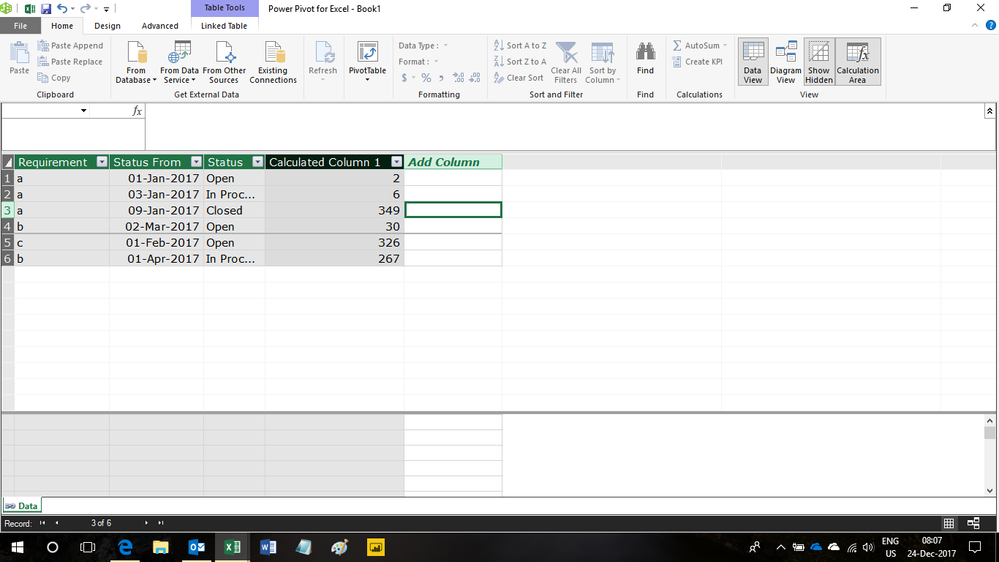
Write a calculated column formula in the PowerPivot
=IF(ISBLANK(CALCULATE(MIN(Data[Status From]),FILTER(data,Data[Requirement]=EARLIER(Data[Requirement])&&Data[Status From]>EARLIER(Data[Status From])))),TODAY(),CALCULATE(MIN(Data[Status From]),FILTER(data,Data[Requirement]=EARLIER(Data[Requirement])&&Data[Status From]>EARLIER(Data[Status From]))))-Data[Status From]
Power Query solution:
let
Source = Table1,
#"Sorted Rows" = Table.Sort(Source,{{"Requirement", Order.Ascending}, {"Status from", Order.Ascending}}),
#"Added Index" = Table.AddIndexColumn(#"Sorted Rows", "Index", 0, 1),
#"Added Index1" = Table.AddIndexColumn(#"Added Index", "Index.1", 1, 1),
#"Merged Queries" = Table.NestedJoin(#"Added Index1",{"Index.1"},#"Added Index",{"Index"},"Next",JoinKind.LeftOuter),
#"Expanded Next" = Table.ExpandTableColumn(#"Merged Queries", "Next", {"Requirement", "Status from"}, {"Next.Requirement", "Next.Status from"}),
#"Added Custom" = Table.AddColumn(#"Expanded Next", "amount of days", each Duration.TotalDays((if [Next.Requirement] <> [Requirement] then DateTime.Date(DateTime.FixedLocalNow()) else [Next.Status from]) - [Status from]), Int64.Type),
#"Removed Columns" = Table.RemoveColumns(#"Added Custom",{"Index", "Index.1", "Next.Requirement", "Next.Status from"})
in
#"Removed Columns"
Hi,
Write a calculated column formula in the PowerPivot
=IF(ISBLANK(CALCULATE(MIN(Data[Status From]),FILTER(data,Data[Requirement]=EARLIER(Data[Requirement])&&Data[Status From]>EARLIER(Data[Status From])))),TODAY(),CALCULATE(MIN(Data[Status From]),FILTER(data,Data[Requirement]=EARLIER(Data[Requirement])&&Data[Status From]>EARLIER(Data[Status From]))))-Data[Status From]
Power Query solution:
let
Source = Table1,
#"Sorted Rows" = Table.Sort(Source,{{"Requirement", Order.Ascending}, {"Status from", Order.Ascending}}),
#"Added Index" = Table.AddIndexColumn(#"Sorted Rows", "Index", 0, 1),
#"Added Index1" = Table.AddIndexColumn(#"Added Index", "Index.1", 1, 1),
#"Merged Queries" = Table.NestedJoin(#"Added Index1",{"Index.1"},#"Added Index",{"Index"},"Next",JoinKind.LeftOuter),
#"Expanded Next" = Table.ExpandTableColumn(#"Merged Queries", "Next", {"Requirement", "Status from"}, {"Next.Requirement", "Next.Status from"}),
#"Added Custom" = Table.AddColumn(#"Expanded Next", "amount of days", each Duration.TotalDays((if [Next.Requirement] <> [Requirement] then DateTime.Date(DateTime.FixedLocalNow()) else [Next.Status from]) - [Status from]), Int64.Type),
#"Removed Columns" = Table.RemoveColumns(#"Added Custom",{"Index", "Index.1", "Next.Requirement", "Next.Status from"})
in
#"Removed Columns"
If you love stickers, then you will definitely want to check out our community sticker challenge, Barcelona edition!
Check out the July 2026 Power BI update to learn about new features.
| User | Count |
|---|---|
| 28 | |
| 28 | |
| 20 | |
| 19 | |
| 19 |
| User | Count |
|---|---|
| 43 | |
| 31 | |
| 18 | |
| 18 | |
| 16 |