FabCon is coming to Atlanta
Join us at FabCon Atlanta from March 16 - 20, 2026, for the ultimate Fabric, Power BI, AI and SQL community-led event. Save $200 with code FABCOMM.
Register now!- Power BI forums
- Get Help with Power BI
- Desktop
- Service
- Report Server
- Power Query
- Mobile Apps
- Developer
- DAX Commands and Tips
- Custom Visuals Development Discussion
- Health and Life Sciences
- Power BI Spanish forums
- Translated Spanish Desktop
- Training and Consulting
- Instructor Led Training
- Dashboard in a Day for Women, by Women
- Galleries
- Data Stories Gallery
- Themes Gallery
- Contests Gallery
- QuickViz Gallery
- Quick Measures Gallery
- Visual Calculations Gallery
- Notebook Gallery
- Translytical Task Flow Gallery
- TMDL Gallery
- R Script Showcase
- Webinars and Video Gallery
- Ideas
- Custom Visuals Ideas (read-only)
- Issues
- Issues
- Events
- Upcoming Events
The Power BI Data Visualization World Championships is back! Get ahead of the game and start preparing now! Learn more
- Power BI forums
- Forums
- Get Help with Power BI
- Desktop
- Re: How to show different value when is first row ...
- Subscribe to RSS Feed
- Mark Topic as New
- Mark Topic as Read
- Float this Topic for Current User
- Bookmark
- Subscribe
- Printer Friendly Page
- Mark as New
- Bookmark
- Subscribe
- Mute
- Subscribe to RSS Feed
- Permalink
- Report Inappropriate Content
How to show different value when is first row in Matrix
Hey all,
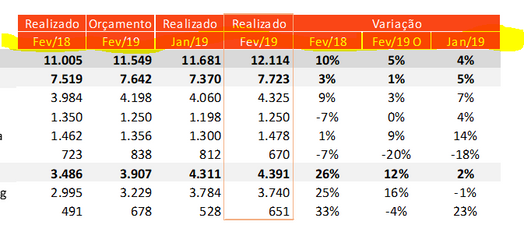
I'm trying include in first row a dynamic value according to the filter. Like this:
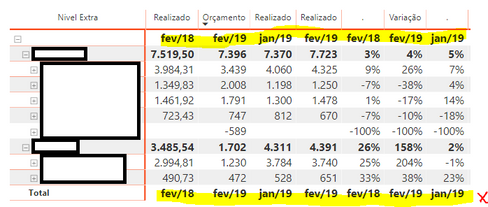
I used the ISINSCOPE to check if scope row is "Nivel Extra", but the total row is also out of "Nivel Extra" scope
I want now a way to show different value when is first row in Matrix
Thanks and sorry for my english.
- Mark as New
- Bookmark
- Subscribe
- Mute
- Subscribe to RSS Feed
- Permalink
- Report Inappropriate Content
Those dates (Fev/19, Fev/18) need to be in the ROWS section of the matrix visual, not the values section.
My data isn't the same as yours, but you can see i have two rows at the top of my matrix, the data type, and my date, which is MMM/YY.
Did I answer your question? Mark my post as a solution!
Did my answers help arrive at a solution? Give it a kudos by clicking the Thumbs Up!
DAX is for Analysis. Power Query is for Data Modeling
Proud to be a Super User!
MCSA: BI Reporting- Mark as New
- Bookmark
- Subscribe
- Mute
- Subscribe to RSS Feed
- Permalink
- Report Inappropriate Content
I want exactly that, but how did you do it?
You can make a pbix sample available. Please.
- Mark as New
- Bookmark
- Subscribe
- Mute
- Subscribe to RSS Feed
- Permalink
- Report Inappropriate Content
Here is a sample file with that format.
Note a few things:
- Look in Power Query to see how the MMM/YY field was generated.
- Note that MMM/YY is text, but is sorted by the "MMM-YY" number field via the Modeling tab.
- See how the fields are in he Visualization, Formatting pane.
Did I answer your question? Mark my post as a solution!
Did my answers help arrive at a solution? Give it a kudos by clicking the Thumbs Up!
DAX is for Analysis. Power Query is for Data Modeling
Proud to be a Super User!
MCSA: BI Reporting- Mark as New
- Bookmark
- Subscribe
- Mute
- Subscribe to RSS Feed
- Permalink
- Report Inappropriate Content
Thanks for the answer, but my column visualization is not in cronologics, follows sames rules, for exemple:
First column is the same filter month as last year;
Second column is budget of the same month filtered;
Third column is the one from the previous month filtered;
And finally the filtered month returns.
When I add the month column in the view, it brings me only the column I'm filtering. So I want to change the first row dynamically, so I can put the correct month / year value.
Helpful resources

Power BI Dataviz World Championships
The Power BI Data Visualization World Championships is back! Get ahead of the game and start preparing now!

| User | Count |
|---|---|
| 61 | |
| 46 | |
| 40 | |
| 38 | |
| 22 |
| User | Count |
|---|---|
| 176 | |
| 131 | |
| 118 | |
| 82 | |
| 54 |


