This is best Fabric, Power BI, SQL and AI community event. How do we know? The last event sold out! Save €200 with code FABCMTY200.
Register nowA new Data Days event is coming soon! This time we’re going bigger than ever. Fabric, Power BI, SQL, AI and more. Don't miss out.
Hello Everyone,
I am creating Power BI reports, which have multiple columns.
first dimension column having fields, and other fact columns generating the data for that selected dimension rows.
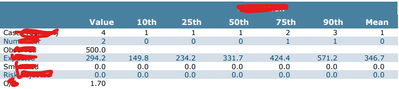
Please find below image for reference.
The issue is, Need to setup the decimal values dynamically after interger.
For Example: Value column will have 0 decimal for first 2 rows and 1 decimal for next 4 rows and 2 decimal for last row.
Please help.
Thanks.
Solved! Go to Solution.
Hello,
I have resolved the issue, I have created measures for all indivisual columns and applied the formatting to each row.
Example:
Hi @AtulsDream
Please try using dynamic format strings:
https://learn.microsoft.com/en-us/power-bi/create-reports/desktop-dynamic-format-strings
Hello,
I have resolved the issue, I have created measures for all indivisual columns and applied the formatting to each row.
Example:
Check out the May 2026 Power BI update to learn about new features.
Sign up to receive a private message when registration opens and key events begin.
If you have recently started exploring Fabric, we'd love to hear how it's going. Your feedback can help with product improvements.
| User | Count |
|---|---|
| 31 | |
| 25 | |
| 25 | |
| 22 | |
| 14 |
| User | Count |
|---|---|
| 61 | |
| 49 | |
| 25 | |
| 20 | |
| 20 |