FabCon is coming to Atlanta
Join us at FabCon Atlanta from March 16 - 20, 2026, for the ultimate Fabric, Power BI, AI and SQL community-led event. Save $200 with code FABCOMM.
Register now!- Power BI forums
- Get Help with Power BI
- Desktop
- Service
- Report Server
- Power Query
- Mobile Apps
- Developer
- DAX Commands and Tips
- Custom Visuals Development Discussion
- Health and Life Sciences
- Power BI Spanish forums
- Translated Spanish Desktop
- Training and Consulting
- Instructor Led Training
- Dashboard in a Day for Women, by Women
- Galleries
- Data Stories Gallery
- Themes Gallery
- Contests Gallery
- QuickViz Gallery
- Quick Measures Gallery
- Visual Calculations Gallery
- Notebook Gallery
- Translytical Task Flow Gallery
- TMDL Gallery
- R Script Showcase
- Webinars and Video Gallery
- Ideas
- Custom Visuals Ideas (read-only)
- Issues
- Issues
- Events
- Upcoming Events
Get Fabric Certified for FREE during Fabric Data Days. Don't miss your chance! Request now
- Power BI forums
- Forums
- Get Help with Power BI
- Desktop
- Re: How to multiply two filtred values in one colu...
- Subscribe to RSS Feed
- Mark Topic as New
- Mark Topic as Read
- Float this Topic for Current User
- Bookmark
- Subscribe
- Printer Friendly Page
- Mark as New
- Bookmark
- Subscribe
- Mute
- Subscribe to RSS Feed
- Permalink
- Report Inappropriate Content
How to multiply two filtred values in one column and then sum them together
I have the following data:
| ID | Location | Metric | Value |
| 1 | A | Population | 1000 |
| 2 | A | Average Income | 50000 |
| 3 | B | Population | 2000 |
| 4 | B | Average Income | 30000 |
| 5 | C | Population | 5000 |
| 6 | C | Average Income | 20000 |
How do I get the following result:
sum(Value of Population * Value of Average Income) / sum(Value of Population)
So when I select locations A and B, it should calculate each location's Value of Population * Value of Average Income then sum them together.
Thanks.
Solved! Go to Solution.
- Mark as New
- Bookmark
- Subscribe
- Mute
- Subscribe to RSS Feed
- Permalink
- Report Inappropriate Content
Hi @Anonymous
Try this measure:
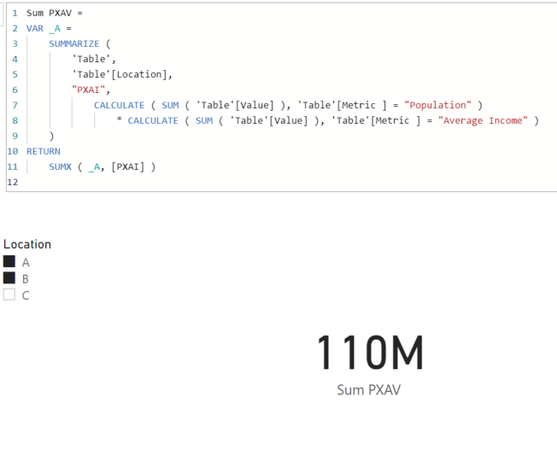
Sum PXAV =
VAR _A =
    SUMMARIZE (
        'Table',
        'Table'[Location],
        "PXAI",
            CALCULATE ( SUM ( 'Table'[Value] ), 'Table'[Metric ] = "Population" )
                * CALCULATE ( SUM ( 'Table'[Value] ), 'Table'[Metric ] = "Average Income" )
    )
RETURN
    SUMX ( _A, [PXAI] )
Output:
If this post helps, please consider accepting it as the solution to help the other members find it more quickly.
Appreciate your Kudos!!
LinkedIn: www.linkedin.com/in/vahid-dm/
- Mark as New
- Bookmark
- Subscribe
- Mute
- Subscribe to RSS Feed
- Permalink
- Report Inappropriate Content
Thank you, this is exactly what I need.
Helpful resources

Power BI Monthly Update - November 2025
Check out the November 2025 Power BI update to learn about new features.

Fabric Data Days
Advance your Data & AI career with 50 days of live learning, contests, hands-on challenges, study groups & certifications and more!

| User | Count |
|---|---|
| 103 | |
| 79 | |
| 57 | |
| 51 | |
| 46 |

