Fabric Data Days starts November 4th!
Advance your Data & AI career with 50 days of live learning, dataviz contests, hands-on challenges, study groups & certifications and more!
Get registered- Power BI forums
- Get Help with Power BI
- Desktop
- Service
- Report Server
- Power Query
- Mobile Apps
- Developer
- DAX Commands and Tips
- Custom Visuals Development Discussion
- Health and Life Sciences
- Power BI Spanish forums
- Translated Spanish Desktop
- Training and Consulting
- Instructor Led Training
- Dashboard in a Day for Women, by Women
- Galleries
- Data Stories Gallery
- Themes Gallery
- Contests Gallery
- Quick Measures Gallery
- Visual Calculations Gallery
- Notebook Gallery
- Translytical Task Flow Gallery
- TMDL Gallery
- R Script Showcase
- Webinars and Video Gallery
- Ideas
- Custom Visuals Ideas (read-only)
- Issues
- Issues
- Events
- Upcoming Events
Get Fabric Certified for FREE during Fabric Data Days. Don't miss your chance! Learn more
- Power BI forums
- Forums
- Get Help with Power BI
- Desktop
- Re: How to hide null columns in matrix table
- Subscribe to RSS Feed
- Mark Topic as New
- Mark Topic as Read
- Float this Topic for Current User
- Bookmark
- Subscribe
- Printer Friendly Page
- Mark as New
- Bookmark
- Subscribe
- Mute
- Subscribe to RSS Feed
- Permalink
- Report Inappropriate Content
How to hide null columns in matrix table
Hi all,
I search this topic in web but i couldn't get enough information about that.
I have a matrix table with 6 measures. it changes by category.
My matrix table looks like that
Category M1 M2 M3 M4 M5 M6
3001 12 5 3 9
3002 19 7 2 6
3007 5 9 1 5
The M5 and M6 columns change by value, Sometimes they don't have value, sometimes have value. I want to hide theese columns when they don't have value. I want to hide them completely. Their headers shouldn't be view.
Is it possible or not ?
Thanks
Solved! Go to Solution.
- Mark as New
- Bookmark
- Subscribe
- Mute
- Subscribe to RSS Feed
- Permalink
- Report Inappropriate Content
@Anonymous,
Add a seperate table that contains column names in one column, then drag the column to Columns, measure below to Values.
Measure =
SWITCH ( SELECTEDVALUE ( Table2[Column1] ), "M1", [M1], "M2", [M2] )
If this post helps, then please consider Accept it as the solution to help the other members find it more quickly.
- Mark as New
- Bookmark
- Subscribe
- Mute
- Subscribe to RSS Feed
- Permalink
- Report Inappropriate Content
@Anonymous Please make sure that you have unchecked the "Show Items with no data" option (under columns)
Did I answer your question? Mark my post as a solution!
Proud to be a PBI Community Champion
- Mark as New
- Bookmark
- Subscribe
- Mute
- Subscribe to RSS Feed
- Permalink
- Report Inappropriate Content
@PattemManohar there aren't a selection like "Show Items with no data" on my case. By the way in rows option there is a seleciton like that but in values, not.
- Mark as New
- Bookmark
- Subscribe
- Mute
- Subscribe to RSS Feed
- Permalink
- Report Inappropriate Content
@Anonymous You need to do that option setting for "Column" fields not for Values fields. Refer below:
Did I answer your question? Mark my post as a solution!
Proud to be a PBI Community Champion
- Mark as New
- Bookmark
- Subscribe
- Mute
- Subscribe to RSS Feed
- Permalink
- Report Inappropriate Content
Values which i use in values entry section, are calculation. I can't use them on columns. Is there another solution for this ?
- Mark as New
- Bookmark
- Subscribe
- Mute
- Subscribe to RSS Feed
- Permalink
- Report Inappropriate Content
Did I answer your question? Mark my post as a solution!
Proud to be a PBI Community Champion
- Mark as New
- Bookmark
- Subscribe
- Mute
- Subscribe to RSS Feed
- Permalink
- Report Inappropriate Content
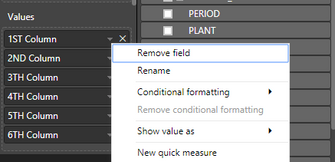
I can't send the data screenshot, what do you want to know about data, i can tell you
Values are measure.
Category and Category2 are Column.
Helpful resources

Fabric Data Days
Advance your Data & AI career with 50 days of live learning, contests, hands-on challenges, study groups & certifications and more!

Power BI Monthly Update - October 2025
Check out the October 2025 Power BI update to learn about new features.

| User | Count |
|---|---|
| 84 | |
| 49 | |
| 36 | |
| 31 | |
| 30 |


