FabCon is coming to Atlanta
Join us at FabCon Atlanta from March 16 - 20, 2026, for the ultimate Fabric, Power BI, AI and SQL community-led event. Save $200 with code FABCOMM.
Register now!- Power BI forums
- Get Help with Power BI
- Desktop
- Service
- Report Server
- Power Query
- Mobile Apps
- Developer
- DAX Commands and Tips
- Custom Visuals Development Discussion
- Health and Life Sciences
- Power BI Spanish forums
- Translated Spanish Desktop
- Training and Consulting
- Instructor Led Training
- Dashboard in a Day for Women, by Women
- Galleries
- Data Stories Gallery
- Themes Gallery
- Contests Gallery
- QuickViz Gallery
- Quick Measures Gallery
- Visual Calculations Gallery
- Notebook Gallery
- Translytical Task Flow Gallery
- TMDL Gallery
- R Script Showcase
- Webinars and Video Gallery
- Ideas
- Custom Visuals Ideas (read-only)
- Issues
- Issues
- Events
- Upcoming Events
Get Fabric Certified for FREE during Fabric Data Days. Don't miss your chance! Request now
- Power BI forums
- Forums
- Get Help with Power BI
- Desktop
- Re: How to have a Tooltip show a full list of valu...
- Subscribe to RSS Feed
- Mark Topic as New
- Mark Topic as Read
- Float this Topic for Current User
- Bookmark
- Subscribe
- Printer Friendly Page
- Mark as New
- Bookmark
- Subscribe
- Mute
- Subscribe to RSS Feed
- Permalink
- Report Inappropriate Content
How to have a Tooltip show a full list of values based on the Matrix column header hovered over?
Hi,
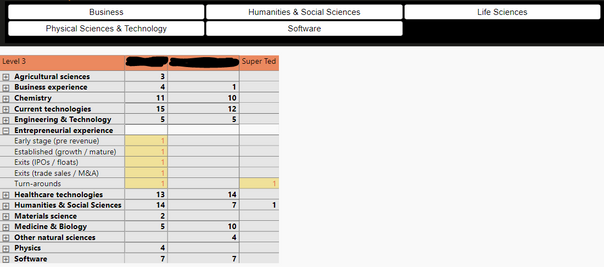
I have a Matrix visual that show Subjects on the rows and People on the columns. There is a Chiclet slicer visual that filters the Matrix. All is working as it should be at this point.
I would like to create Tooltip so when the user hovers over a cell value (regardless which row/column intersect cell) a Tooltip appears showing all Subjects (ignoring the Matrix's row context and the Chiclet slicer filtering) for the Person in which the column hovering is taking place.
For example, take a look at the below visual
If the user was to hover over any cell under the 'Super Ted' user column, a Tooltip (containing a Table visual) would appear listing all lowest level values (in the visual above the lowest level (level 4) of the hierarchy is expanded for 'Enterpreneurial experience'). So the Tooltip would show a long list of lowest hierarchy level values, however many values the person has a 1 for, which is not filtered by the Chiclet slicer or the Matrix's row context.
I've tried a few different DAX measures so far, none have worked. Below is my latest effort. The is a relationship (1 to * ) between the Checklist and the Mentor tables. The Chiclet slicer values are tied to the Checklist table's Level 2 hierarchy. In the Matrix itself is the Checklist table's Level 3 values, which in turn can be expanded to the Level 4 values.
CALCULATE (
CONCATENATEX ( Checklist, VALUES ( Checklist[Level 4] ), " " ),
ALLEXCEPT ( Mentor, Mentor[Mentor Name] )
)
Then how to write the DAX Measure to achieve it?
Thanks.
Solved! Go to Solution.
- Mark as New
- Bookmark
- Subscribe
- Mute
- Subscribe to RSS Feed
- Permalink
- Report Inappropriate Content
@dax - Zoe, thanks for your response.
I've managed to solve this myself by creating the following measure, that is embedded into the Tooltip visual.
- Mark as New
- Bookmark
- Subscribe
- Mute
- Subscribe to RSS Feed
- Permalink
- Report Inappropriate Content
Hi @D_PBI ,
Interesting workaround, do you have any idea on how to display all level 4 by row instead of a concatenate cell?
Best
- Mark as New
- Bookmark
- Subscribe
- Mute
- Subscribe to RSS Feed
- Permalink
- Report Inappropriate Content
Hi @D_PBI ,
I am not clear about your requirement, could you please explain "If the user was to hover over any cell under the 'Super Ted' user column, a Tooltip (containing a Table visual) would appear listing all lowest level values (in the visual above the lowest level (level 4) of the hierarchy is expanded for 'Enterpreneurial experience'). " to me in details?
If you don't want context or slicer to affect the tootips, you could try to disable "keep all filters" in Tooltip page, Then show value in details not summarize data in tooltip.
Best Regards,
Zoe Zhi
If this post helps, then please consider Accept it as the solution to help the other members find it more quickly.
- Mark as New
- Bookmark
- Subscribe
- Mute
- Subscribe to RSS Feed
- Permalink
- Report Inappropriate Content
@dax - Zoe, thanks for your response.
I've managed to solve this myself by creating the following measure, that is embedded into the Tooltip visual.
Helpful resources

Power BI Monthly Update - November 2025
Check out the November 2025 Power BI update to learn about new features.

Fabric Data Days
Advance your Data & AI career with 50 days of live learning, contests, hands-on challenges, study groups & certifications and more!

| User | Count |
|---|---|
| 103 | |
| 80 | |
| 62 | |
| 51 | |
| 45 |

