New Offer! Become a Certified Fabric Data Engineer
Check your eligibility for this 50% exam voucher offer and join us for free live learning sessions to get prepared for Exam DP-700.
Get Started- Power BI forums
- Get Help with Power BI
- Desktop
- Service
- Report Server
- Power Query
- Mobile Apps
- Developer
- DAX Commands and Tips
- Custom Visuals Development Discussion
- Health and Life Sciences
- Power BI Spanish forums
- Translated Spanish Desktop
- Training and Consulting
- Instructor Led Training
- Dashboard in a Day for Women, by Women
- Galleries
- Community Connections & How-To Videos
- COVID-19 Data Stories Gallery
- Themes Gallery
- Data Stories Gallery
- R Script Showcase
- Webinars and Video Gallery
- Quick Measures Gallery
- 2021 MSBizAppsSummit Gallery
- 2020 MSBizAppsSummit Gallery
- 2019 MSBizAppsSummit Gallery
- Events
- Ideas
- Custom Visuals Ideas
- Issues
- Issues
- Events
- Upcoming Events
Don't miss out! 2025 Microsoft Fabric Community Conference, March 31 - April 2, Las Vegas, Nevada. Use code MSCUST for a $150 discount. Prices go up February 11th. Register now.
- Power BI forums
- Forums
- Get Help with Power BI
- Desktop
- How to get Subtotal Percentage
- Subscribe to RSS Feed
- Mark Topic as New
- Mark Topic as Read
- Float this Topic for Current User
- Bookmark
- Subscribe
- Printer Friendly Page
- Mark as New
- Bookmark
- Subscribe
- Mute
- Subscribe to RSS Feed
- Permalink
- Report Inappropriate Content
How to get Subtotal Percentage
Hi , I would like to request an advice on how to fetch a subtotal percentage
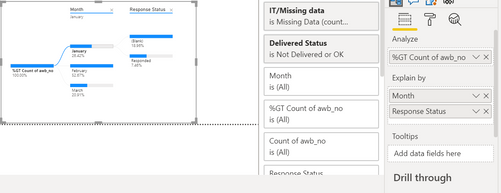
I have use Decomposition Tree Graph to show breakdown of a Total amount of Data and i would like to create a breakdown based on month and breakdown percentage of response status as shown in the image. The image shown is a breakdown , I would like the graph to calculate percentage 46/163 instead of 46/617
How can i get a Subtotal percentage of January , February and March
Thank you for the help
Solved! Go to Solution.
- Mark as New
- Bookmark
- Subscribe
- Mute
- Subscribe to RSS Feed
- Permalink
- Report Inappropriate Content
Hi @AmirFirdaus9509 ,
Please refer to my .pbix file.
Measure =
IF(
    HASONEFILTER(Sheet14[C1]) = TRUE(),
    IF(
        HASONEFILTER(Sheet14[C2]) = FALSE(),
        DIVIDE(
            SUMX( FILTER( ALL(Sheet14), [C1] = MAX([C1]) ), [Value] ),
            SUMX( ALL(Sheet14), [Value])
        ),
        DIVIDE(
            SUMX( FILTER( ALL(Sheet14), [C1] = MAX([C1]) && [C2] = MAX([C2]) ), [Value] ),
            SUMX( FILTER( ALL(Sheet14), [C1] = MAX([C1]) ), [Value] )
        )
    ),
    1
)
Best regards,
Lionel Chen
If this post helps, then please consider Accept it as the solution to help the other members find it more quickly.
- Mark as New
- Bookmark
- Subscribe
- Mute
- Subscribe to RSS Feed
- Permalink
- Report Inappropriate Content
@AmirFirdaus9509 , if possible try a measure like
divide([Measure], calculate([meausre], removefilters(Table[Response Status])))
- Mark as New
- Bookmark
- Subscribe
- Mute
- Subscribe to RSS Feed
- Permalink
- Report Inappropriate Content
Hi @amitchandak ,
I have tried to recreate based on your measure through my knowledge
as am i not experienced with PBI , is this correct?
Thank you again
- Mark as New
- Bookmark
- Subscribe
- Mute
- Subscribe to RSS Feed
- Permalink
- Report Inappropriate Content
Hi @AmirFirdaus9509 ,
Please refer to my .pbix file.
Measure =
IF(
    HASONEFILTER(Sheet14[C1]) = TRUE(),
    IF(
        HASONEFILTER(Sheet14[C2]) = FALSE(),
        DIVIDE(
            SUMX( FILTER( ALL(Sheet14), [C1] = MAX([C1]) ), [Value] ),
            SUMX( ALL(Sheet14), [Value])
        ),
        DIVIDE(
            SUMX( FILTER( ALL(Sheet14), [C1] = MAX([C1]) && [C2] = MAX([C2]) ), [Value] ),
            SUMX( FILTER( ALL(Sheet14), [C1] = MAX([C1]) ), [Value] )
        )
    ),
    1
)
Best regards,
Lionel Chen
If this post helps, then please consider Accept it as the solution to help the other members find it more quickly.
- Mark as New
- Bookmark
- Subscribe
- Mute
- Subscribe to RSS Feed
- Permalink
- Report Inappropriate Content
@AmirFirdaus9509 , "values" which is giving DPMonth, does not seem correct to me.
Can you share a sample pbix after removing sensitive data.
Helpful resources

Join us at the Microsoft Fabric Community Conference
March 31 - April 2, 2025, in Las Vegas, Nevada. Use code MSCUST for a $150 discount! Prices go up Feb. 11th.

Power BI Monthly Update - January 2025
Check out the January 2025 Power BI update to learn about new features in Reporting, Modeling, and Data Connectivity.

| User | Count |
|---|---|
| 147 | |
| 85 | |
| 66 | |
| 52 | |
| 46 |
| User | Count |
|---|---|
| 215 | |
| 90 | |
| 83 | |
| 66 | |
| 58 |


