Fabric Data Days starts November 4th!
Advance your Data & AI career with 50 days of live learning, dataviz contests, hands-on challenges, study groups & certifications and more!
Get registered- Power BI forums
- Get Help with Power BI
- Desktop
- Service
- Report Server
- Power Query
- Mobile Apps
- Developer
- DAX Commands and Tips
- Custom Visuals Development Discussion
- Health and Life Sciences
- Power BI Spanish forums
- Translated Spanish Desktop
- Training and Consulting
- Instructor Led Training
- Dashboard in a Day for Women, by Women
- Galleries
- Data Stories Gallery
- Themes Gallery
- Contests Gallery
- QuickViz Gallery
- Quick Measures Gallery
- Visual Calculations Gallery
- Notebook Gallery
- Translytical Task Flow Gallery
- TMDL Gallery
- R Script Showcase
- Webinars and Video Gallery
- Ideas
- Custom Visuals Ideas (read-only)
- Issues
- Issues
- Events
- Upcoming Events
Get Fabric Certified for FREE during Fabric Data Days. Don't miss your chance! Request now
- Power BI forums
- Forums
- Get Help with Power BI
- Desktop
- Re: How to get 0 to show in values instead of noth...
- Subscribe to RSS Feed
- Mark Topic as New
- Mark Topic as Read
- Float this Topic for Current User
- Bookmark
- Subscribe
- Printer Friendly Page
- Mark as New
- Bookmark
- Subscribe
- Mute
- Subscribe to RSS Feed
- Permalink
- Report Inappropriate Content
How to get 0 to show in values instead of nothing in a Matrix Visual?
Hello,
I am currently making a matrix visual with a value assiociated with a person and a month, however, in the months that show no data I cannot get the matrix visual to show a 0. I have tried using:
measure = 'table[column]' + 0
and
Measure = if(isblank('table[column],0,[column]))
but niether fix the problem, they still show no value at all when i use the new measure instead of the original column in the 'Values' section of the visual.
I think this may be because there are no 0 values in the underlying table for the column in question?
Thanks in advance, matrix in question pictured below.
Solved! Go to Solution.
- Mark as New
- Bookmark
- Subscribe
- Mute
- Subscribe to RSS Feed
- Permalink
- Report Inappropriate Content
Thank you for your response, I have tried it using the sum function and that did not work either.
Can I ask what you mean by dimension table and star schema?
Thanks
- Mark as New
- Bookmark
- Subscribe
- Mute
- Subscribe to RSS Feed
- Permalink
- Report Inappropriate Content
Hi @Anonymous ,
I created some data:
Fact Table:
It contains all the primary keys of the dimension and associated facts or measures(is a property on which calculations can be made) like count of items, total sales, average of sales etc.
Dimension Tables:
Dimension tables provides descriptive information for all the measurements recorded in fact table.
Dimensions are relatively very small in comparison of fact table.
A fact table holds the data to be analyzed, and a dimension table stores data about the ways in which the data in the fact table can be analyzed.
About star schema, you can check it in this link:
https://docs.microsoft.com/en-us/power-bi/guidance/star-schema?source=docs
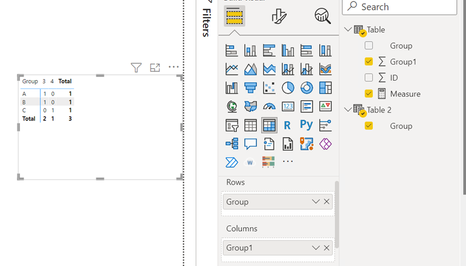
Here are the steps you can follow:
1. Create calculated table.
Table 2 =
DISTINCT('Table'[Group])
2. Join relationship between two tables
3. Create measure.
Measure =
COUNT('Table'[ID]) +0
4. Result:
If you need pbix, please click here.
Best Regards,
Liu Yang
If this post helps, then please consider Accept it as the solution to help the other members find it more quickly
- Mark as New
- Bookmark
- Subscribe
- Mute
- Subscribe to RSS Feed
- Permalink
- Report Inappropriate Content
@Anonymous , hopefully, the measure is like
measure = sum('table[column]') + 0
+0 works best when you date, agent etc come from the dimension table and you are in star schema.
But some missing combination it will not work
- Mark as New
- Bookmark
- Subscribe
- Mute
- Subscribe to RSS Feed
- Permalink
- Report Inappropriate Content
Thank you for your response, I have tried it using the sum function and that did not work either.
Can I ask what you mean by dimension table and star schema?
Thanks
Helpful resources

Fabric Data Days
Advance your Data & AI career with 50 days of live learning, contests, hands-on challenges, study groups & certifications and more!

Power BI Monthly Update - October 2025
Check out the October 2025 Power BI update to learn about new features.


