
Get certified for free when you join Fabric Data Days 2026 and dive into Fabric, Power BI, SQL, AI, and other essential data skills.
Join nowJuly 28 - August 9 | Final Round of the Power BI Dataviz World Championships. This is your chance. Learn more
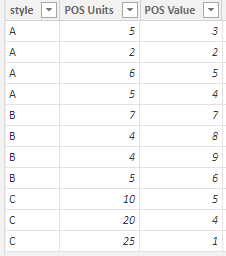
I've got a table with the below headers....
I will post a sample file if needed, I just thought this potentially could be easy for the experts here 🙂
All I want to do is create another column that divides the "pos value" by "pos units" for each row (style) which gets me.... "Average Unit Price"
Then I would like another column to allow me to create ranges for this column below
$0-$5
$5.01-$10
$10.01-$20
>$20
My end goal is to compare $ sales from each of these Average Unit Price ranges
Solved! Go to Solution.
Hi @Anonymous ,
I created some data:
Here are the steps you can follow:
1. Create calculated column.
Divide =
DIVIDE([POS Units],[POS Value])Avg =
AVERAGEX(FILTER(ALL('Table'),'Table'[style]=EARLIER('Table'[style])),[Divide])ranges =
SWITCH(
TRUE(),
[Avg]>=0&&[Avg]<=5,"$0-$5",
[Avg]>=5.01&&[Avg]<=10,"$5.01-$10",
[Avg]>=10.01&&[Avg]<=20,"$10.01-$20",
">$20")
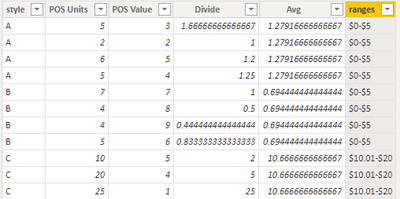
2. Result:
Best Regards,
Liu Yang
If this post helps, then please consider Accept it as the solution to help the other members find it more quickly
Hi @Anonymous ,
I created some data:
Here are the steps you can follow:
1. Create calculated column.
Divide =
DIVIDE([POS Units],[POS Value])Avg =
AVERAGEX(FILTER(ALL('Table'),'Table'[style]=EARLIER('Table'[style])),[Divide])ranges =
SWITCH(
TRUE(),
[Avg]>=0&&[Avg]<=5,"$0-$5",
[Avg]>=5.01&&[Avg]<=10,"$5.01-$10",
[Avg]>=10.01&&[Avg]<=20,"$10.01-$20",
">$20")
2. Result:
Best Regards,
Liu Yang
If this post helps, then please consider Accept it as the solution to help the other members find it more quickly
@Anonymous , Assume you have column price then you van have a new column
Switch( True(),
[Price] <= 5, " $0-$5",
[Price] <= 10, " $5.01-$10",
[Price] <= 20, "$10.01-$20",
">$20"
)
If you need that on measure refer
Dynamic Segmentation Bucketing Binning
https://community.powerbi.com/t5/Quick-Measures-Gallery/Dynamic-Segmentation-Bucketing-Binning/m-p/1...
Dynamic Segmentation, Bucketing or Binning: https://youtu.be/CuczXPj0N-k
Join us in Barcelona for FabCon and SQLCon, the Fabric, Power BI, SQL, and AI community event. Save €200 with code FABCMTY200.
If you love stickers, then you will definitely want to check out our community sticker challenge, Barcelona edition!
Check out the July 2026 Power BI update to learn about new features.
| User | Count |
|---|---|
| 30 | |
| 28 | |
| 24 | |
| 23 | |
| 16 |
| User | Count |
|---|---|
| 46 | |
| 32 | |
| 17 | |
| 17 | |
| 16 |