Fabric Data Days starts November 4th!
Advance your Data & AI career with 50 days of live learning, dataviz contests, hands-on challenges, study groups & certifications and more!
Get registered- Power BI forums
- Get Help with Power BI
- Desktop
- Service
- Report Server
- Power Query
- Mobile Apps
- Developer
- DAX Commands and Tips
- Custom Visuals Development Discussion
- Health and Life Sciences
- Power BI Spanish forums
- Translated Spanish Desktop
- Training and Consulting
- Instructor Led Training
- Dashboard in a Day for Women, by Women
- Galleries
- Data Stories Gallery
- Themes Gallery
- Contests Gallery
- QuickViz Gallery
- Quick Measures Gallery
- Visual Calculations Gallery
- Notebook Gallery
- Translytical Task Flow Gallery
- TMDL Gallery
- R Script Showcase
- Webinars and Video Gallery
- Ideas
- Custom Visuals Ideas (read-only)
- Issues
- Issues
- Events
- Upcoming Events
Get Fabric Certified for FREE during Fabric Data Days. Don't miss your chance! Request now
- Power BI forums
- Forums
- Get Help with Power BI
- Desktop
- How to create a cluster column chart by joining 2 ...
- Subscribe to RSS Feed
- Mark Topic as New
- Mark Topic as Read
- Float this Topic for Current User
- Bookmark
- Subscribe
- Printer Friendly Page
- Mark as New
- Bookmark
- Subscribe
- Mute
- Subscribe to RSS Feed
- Permalink
- Report Inappropriate Content
How to create a cluster column chart by joining 2 tables
Hi
I am pulling data from 2 tables
Table 1 - "plan"
| Team | Activity | Cost |
| A | Webinar | 100 |
| A | Podcast | 150 |
| A | Video | 25 |
| B | Webinar | 50 |
| B | Paid Media | 200 |
Table 2 - "actual" (this table does not have activity and team broken down into unique columns.
| Program | Cost |
| Ops - A- Webinar | 25 |
| Ops - A - Podcast | 300 |
| Ops - A - Video | 5 |
| Ops - B - Webinar | 10 |
| Ops - B - Paid Media | 350 |
I would like to creata a cluster chart showing 'plan' vs 'actual' for each activity. Team names are filters on the dashboard. How can I parse out initial text from table 2 such that I can group these activities by Team ?
Thanks
Solved! Go to Solution.
- Mark as New
- Bookmark
- Subscribe
- Mute
- Subscribe to RSS Feed
- Permalink
- Report Inappropriate Content
Hi @saipawar
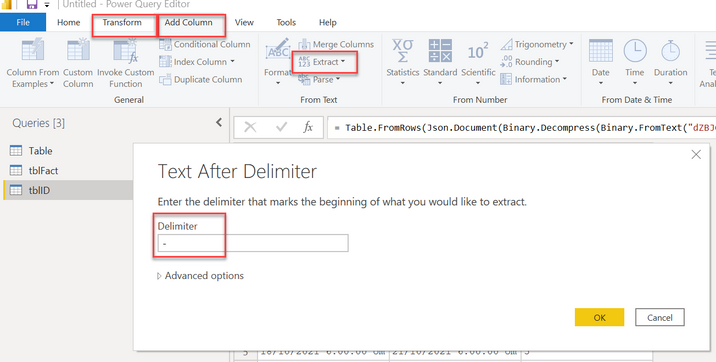
You can use Power Query very easily to achieve this. Just go to either Transform or Add Column (use Add Column if you want to keep original column) and then click on Extract "After Delimiter" like below. Add the "-" and click okay.
Once you have done the above, you can use "Trim" in the "Transform" tab under "Format" to clean up any blank spaces.
Hope this helps 🙂
Theo
If I have posted a response that resolves your question, please accept it as a solution to formally close the post.
Also, if you are as passionate about Power BI, DAX and data as I am, please feel free to reach out if you have any questions, queries, or if you simply want to connect and talk to another data geek!
Want to connect?www.linkedin.com/in/theoconias
Helpful resources

Fabric Data Days
Advance your Data & AI career with 50 days of live learning, contests, hands-on challenges, study groups & certifications and more!

Power BI Monthly Update - October 2025
Check out the October 2025 Power BI update to learn about new features.


